A collection of various GIS related links, information and other GIS blogs.

Wednesday, December 09, 2009

Bye Bye Geography Network

After a nine-year run, the Geography Network will be closing up shop at the end of 2009.

With so much data on ArcGIS Online with multiple ways to access it and so many other web services available, ESRI has decided the time has come to shut it down.

Here’s the blog post about it: http://blogs.esri.com/Support/blogs/arcgisonline/archive/2009/12/09/geography-network-to-retire.aspx

Thursday, August 20, 2009

DEPRECATION PLAN FOR ARCGIS 9.3.1 AND ARCGIS 9.4

It is time to start thinking about your back-end systems and development environments and OS’s and…

New document just released to the ESRI Support pages that discusses platform changes at the current 9.3.1 release, and the next release – 9.4.

It will be interesting to see what parts of the changes at 9.4 get the most interest (Noise? Worry? Joy?) from clients, and also in the social networking realm – especially Twitter.

See Technical Article 37113 for more details.

Friday, May 22, 2009

What’s a GIS Developer To Do @ UC??

Are you a GIS Developer (or hope to be one when you grow up?)?

Are you going to be at the User Conference this year?

Are you looking at the ginormous UC agenda and getting eye strain?

Not sure what to search for in the Online Agenda?

Fear no more – your friends at the ArcGIS Developer Blog have done the heavy lifting for you!

They have boiled down the agenda and come up with this Road Map for the 2009 User Conference, focusing on workshops and sessions that are focused on topics that you, as a GIS Developer, might be interested in. Looks like they missed the Thursday Night Party and the Map Gallery Opening – but you all don’t care about those social events do you?  =)

Hope you have a great time at the UC – tons of fun and a lot to learn.

ArcGIS Developers: Road Map for the 2009 User Conference

Map Templates Resource Center

You might be interested in reviewing what is now available at the ESRI Resource Centers Map Template Gallery.

As described in this blog post on the Mapping Center blog, these templates are not simply an MXT as you might expect. These templates are ZIP files that include an example map (.MXD) so you can see how a map was made, some sample data so you can see the structure of the data, and documentation as well so that all levels of GIS users will know where to start and what tasks are needed. Some of the templates will also include things like GP tools/models or maybe an example web app and code.

Take a look – currently I am seeing templates for Topo at varying scales, Geologic, Street Map, and Reference Map. Hopefully we will see all of you out there in the Community begin to add your template examples as well!

Tuesday, May 19, 2009

Tweet Tweet

Been using Twitter now for a few months. “Micro-Blogging” yet so very different from a blog. Been through a few desktop applications to better my Twitter experience, but was still using http://twitter.com when out and about on my Windows Mobile device. I knew there had to be something better.

Where to turn? To Twitter of course! I had seen folks Tweeting about different applications for the Blackberry – then did see a series of Tweets about Windows Mobile – this is where I learned about Twikini.

So I grabbed the beta and liked it right away. Easy to use, and code updates often with new features. I’m really liking it. Be sure to check out the menus as there are lots of features in there. Also see the main features here.

You can even add your location information to your Tweets:

image

If you are on Twitter and have a Windows Mobile device, I recommend that you take a look at Twikini. Oh ya – if you are interested in following me, I am @Tim_Craig

Friday, May 01, 2009

Jack Interview-O-Rama

Lots of interviews with Jack Dangermond, Founder and President of ESRI this week.

Government Technology (GovTech) - http://www.govtech.com/gt/articles/652976 

O’Reilly radar had a three-part interview:
Part 1 of 3: Web Mapping
Part 2 of 3: Sharing Government GIS Data
Part 3 of 3: The GeoWeb

Monday, April 13, 2009

GIS in the Survey World

Brent Jones from ESRI delivering the keynote address “Why GIS Needs Land Surveyors” at the 2nd annual Carlson User Conference (2009).

Tuesday, March 31, 2009

Tips for Mapping Shorelines

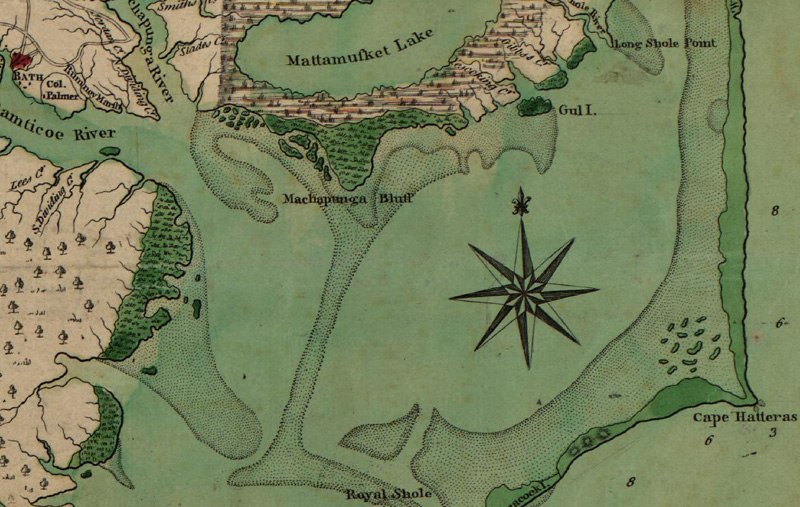
A recent “Ask a Cartographer” question dealt with mapping shorelines to look like the styles found in old-time maps like the example below.

Trees

This Mapping Center post covers multiple ways to symbolize vector and raster data. Good details and lots of graphics.

See the full post here.

What’s the Story on VB6 & VBA ESRI?

I’m glad you asked!

We have been talking about Microsoft dropping support for VB and VBA for some time, but it looks like this was still new news to a lot of folks at the #devsummit.

So here’s some updated information, specifically looking at the 9.3.1 and 9.4 releases and beyond.

Sunday, March 29, 2009

ESRI Developer Summit – Lots of News

The ESRI Developer Summit took place last week in Palm Springs, following right on the heels of the Business Partner Conference.

Like many of you, I was not there. But sometimes I felt like I was just from following all the action on Twitter. Folks were sending a fair number of tweets during the BPC. But it was during the Developer Summit that the Twitter action really took off! Interested in seeing what was discussed? You can follow the hash tag for the Summit - #devsummit.

Keep an eye on the Developer Summit events page on ESRI.com – they have already posted some video, and more will be available in the coming weeks.

There have also been a lot of attendees posting on their blogs about the event:

Another fantastic resource that many of the #devsummit presenters have taken advantage of is the slideshare site. In particular there has been a tag created here for “esri” & one for “devsummit” as well – so you can find all all of the presentations in one place. There is some good stuff here – even without the presenter.

If you know of any blog posts or other interesting Developer Summit related resources that should be listed here, please leave a comment and let me know. Thanks!

Follow me on Twitter @Tim_Craig

Mapping the Seven Sins

Thought you might find this article interesting. It is about the “spatial distribution of the Seven Deadly Sins”. And what an interesting choice of states to focus on for this topic – Nevada!

Take a look HERE for the full article and graphics.

Thursday, March 26, 2009

ESRI / Microsoft Virtual Earth Partnership Announced

This week during the Environmental Systems Research Institute Developer Conference in Palm Springs, CA, ESRI announced their extended partnership with Microsoft’s Virtual Earth business unit granting native access to Virtual Earth’s imagery and road network map data within ArcGIS Desktop and Server. How’s that for a footprint? At the very least it makes the GIS world a bit more interesting, no?

See blog post on MSDN for the official announcement!

Tuesday, March 10, 2009

Wednesday, March 04, 2009

Symbolizing Trees – ESRI Mapping Center

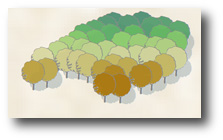
[ This is a little bit different – how to symbolize a stand of trees in ArcMap and have a gradation of colors going through the stand. The result is pretty interesting. ]

http://tinyurl.com/cqttyy

Trees

We recently got this in an email from an ESRI colleague:

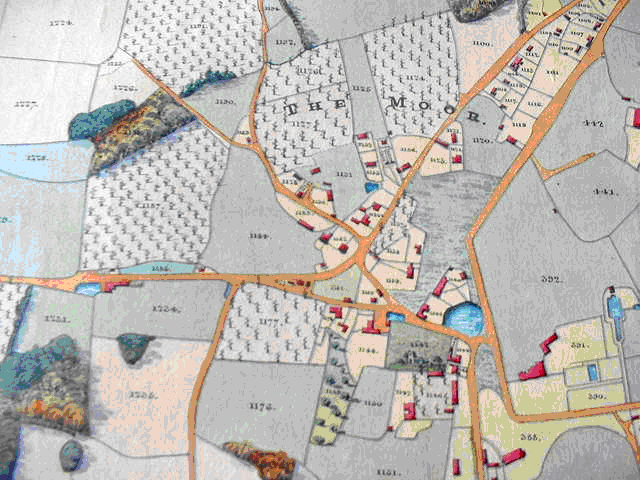
"I went to TOSCA's (The Oxford Seminars in Cartography) Field Trip last night in the Christ Church Library. There were lots of 16th and 17th century maps to be seen. One of the most striking was Frederick Young's Plan of the Parish of Hawkhurst (1818). The way the small woods are depicted and symbolised is fantastic. The symbology of the bushy tree is graded from yellow/brown to green. Can we do this in ArcGIS?"

You can see what he is talking about in this excerpt from the map:

Trees

It seemed to me that it might be possible to do this with point features and a modification of some symbology shown in one of our earlier blog entries called Restricted Color Ramp. The trees in this example are point features that were symbolized using character marker symbols. These multi-layer symbols were defined using the ESRI US Forestry 2 font. The top layer is a dark green outline and the bottom is a green fill. We locked the top layer so its color wouldn’t change but for the fill we used a color ramp to give each tree a slightly different color green so that it would look more realistic. In the blog entry, we describe how you can restrict the range of colors that are used from the color ramp. This was done to make sure that the trees were all in the hue of green with different saturation and value levels.

Read the rest in the full post at: http://tinyurl.com/cqttyy

Friday, February 27, 2009

Map Use, the Quintessential Book on How to Read and Analyze Maps – ESRI Press

New book from ESRI Press.

"Map Use was written for people who want to use maps to better understand not only the physical environment but the human, social, political, and economic environments as well," says A. Jon Kimerling, the book's co-author and interim chairman of the Department of Geosciences at Oregon State University in Corvallis. "This sixth edition takes readers beyond the graphic symbols that comprise maps and into cartographers' decision-making processes to give them the insights they need to better use maps."

Read more about it: http://tinyurl.com/cpqroa

Tip on Curved Annotation Editing

Tip from Charlie Frye on a shortcut to editing curved annotation in ArcMap:

http://blogs.esri.com/Support/blogs/mappingcenter/archive/2009/01/30/tip-for-editing-curved-annotation.aspx

Tuesday, February 24, 2009

What I wish I had known about ModelBuilder before I started using it – ESRI Mapping Center

[ This is a nice list of things (13 of them) you might not know about ModelBuilder that will make your life easier when using it. Always nice to have Tip & Tricks in one place to find!  - full post at: http://blogs.esri.com/esri/arcgis/2009/02/20/10-things-i-wish-i-had-known-about-model-builder-before-i-started-using-it/ ]
We’ve been compiling a list of "What I wish I had known about ModelBuilder before I started using it". Here are a few things that made the list:
  1. Create personalized tools in ModelBuilder: Until a few days ago, I thought the ModelBuilder editing window (the one that you access when you right click a model that you made adn select Edit) was the only environment I could interact with. For years, I dragged and dropped folders and features into the tools of the ModelBuilder editing window before clicking the black triangle to run the processes. Recently I discovered that ModelBuilder is the editing environment to create a custom tool from existing tools and personalized parameters and conditions. But then when you double click the tool in the ArcToolbox window, you get right into the user interface for the tool.
  2. Controlling the flow: Setting preconditions and parameters in ModelBuilder guarantees that the geoprocessing operations will run in the correct order. For example, I wanted to create a tool that projected a dataset into a new personal database, which I set as a parameter of my model. Before projecting the feature dataset, the new personal geodatabase had to be created. I relayed this information to ModelBuilder by right clicking the Project tool and setting the new personal geodatabase as a precondition. I also had several other parameters in my model, including a coordinate system and a geographic transformation method. Since the geographic transformation depends on the selected coordinate system, I set the coordinate system as a parameter before I set the geographic transformation method as a parameter.
  3. In-line variable substitution: In-line variable substitution is useful if you have a model parameter that serves as a precondition to another process in your model. Using the example above, I wanted to create a tool that projected a dataset into a new personal database, which I set as a parameter. The name and location of the new personal geodatabase is only defined when the model is run, so I had to use in-line variable substitution to parse the processes together within the same model. With a precondition set on the new personal geodatabase, the output notation for the projected dataset is %new personal geodatabase%\ProjectedDatasetName. Note that the new personal geodatabase name is enclosed with the percent signs (%new personal geodatabase%).
  4. Editing tool documentation: The tool and parameter descriptions for a model can be edited in ArcMap by right-clicking the model and selecting Edit Documentation. You can add as much information about the tool/model as you like. The most useful documentation for me is the Abstract and Parameters Dialog Reference. The Abstract allows you to fill in information about what the tool does. The Parameters Dialog Reference allows you to fill in information about the parameters and can be populated by selecting Dialog Reference under the parameter name. You can then click one of the icons to add paragraphs, links, illustrations, code and formatting options. You can also documentation for the parameter by right clicking the tool in the Model Builder window and selecting Edit Documentation. Remember to click Finish or OK when you are done editing. Now, when you double-click your model, you will see the Abstract and the content that you added for each parameter of the model.
  5. Model environments and overrides: There are three places to where you can set your model Environments. One is at the ArcToolbox level, another is at the model/tool level, and the third is at the process level. The Environments setting at the process level in ModelBuilder will override the Environments setting at the model/tool level. The Environments setting at the Model/Tool level will override the default at the ArcToolbox level. This gives you the flexibility to define general Environment settings for the majority of processes in your model, but tailor specific settings to specific processes
  6. Current workspace: This is the directory from which inputs are taken and into which outputs are placed. If you set this (right click the tool in ArcToolbox, click Properties, click on the Environments tab, click General Settings, click Current Workspace and point to the directory you want to use), then your tool will automatically point to the same directory every time so you don’t have to keep navigating to the location. When I create a new tool, I also create a "Tooldata" folder in the directory that stores my tool. It contains some sample data which, when I set it as my Current Workspace, is used as input and it is where the outputs of the model will be placed. That way the tool knows where the data for inputs and the location for outputs should be.
  7. Intermediate data: When you run a model, output data is created for each process in the model. Some of the data created is of no use after the model is run since it was only created to connect to another process that creates new output – this is called “intermediate data”. To set a data variable to be intermediate, right-click the data variable and check the option to set it as intermediate data. If it is intermediate data, it will be written to the scratch workspace.
  8. Scratch workspace: This is the directory for temporary storage of execution results that are created with an auto-generated name. As with the Current Directory, when I create a new tool, I also create a “Scratch” folder in the directory that stores my tool and the Tooldata folder. I set this as my Scratch Workspace. That way the tool knows where the temp files should be placed. This way I can easily delete them or use the model to delete them when I am done with the processing.
Hit the site to view the rest – 13 total when I posted this (link updated July 7, 2012): http://blogs.esri.com/esri/arcgis/2009/02/20/10-things-i-wish-i-had-known-about-model-builder-before-i-started-using-it/

Wednesday, February 11, 2009

Opening the Landsat Archive

[ I thought some folks out there might find this of interest in case they weren’t notified ]

Electronic access to the entire USGS Landsat 7 archive, enabling users to download standard-format scenes at no charge, has been an amazing success, with over 225,000 scenes downloaded since October 1, 2008.

Previously acquired imagery from Landsat 1 through Landsat 5, is also now available for download at no charge using the same standard processing format. Processing parameters and other details about the products can be found at http://landsat.usgs.gov/products_data_at_no_charge.php

<http://landsat.usgs.gov/products_data_at_no_charge.php> .

Previously offered USGS Landsat products with customer-defined options, including media, are no longer available.

Newly acquired Landsat 7 ETM+ SLC-off and Landsat 5 TM images with less than 40 percent cloud cover are automatically processed and made available for immediate download. Imagery with greater than 40 percent cloud cover can be processed upon request. Once the requested scenes are processed, an email notification is sent to the customer with instructions for downloading. These scenes will then become accessible to all users.

Landsat data can be searched, downloaded, or requested from GloVis or EarthExplorer. High demand for this data may result in slow search performance and processing times, which typically range from 1-3 days for Landsat 7 ETM+ and some Landsat 5 TM data and 3-4 weeks for Landsat

1-5 MSS, Landsat 4 TM and some Landsat 5 TM data. Please contact Customer Service at custserv@usgs.gov with any comments or questions.

Landsat scenes can be requested and downloaded from Glovis (http://glovis.usgs.gov <http://glovis.usgs.gov/> ) or Earth Explorer (http://earthexplorer.usgs.gov <http://earthexplorer.usgs.gov/> ).

Monday, February 09, 2009

ArcGIS Mobile Videos

ArcGIS 9.3: Improve mobility using ArcGIS Mobile

ArcGIS 9.3:  See an example of how an Insurance Claims Manager uses ArcGIS and a mobile solution

ArcGIS 9.3: Disseminate Information To The Field Using ArcGIS Mobile

ArcGIS Mobile Questions and Answers

ArcGIS Mobile Users Conference Demo

Do You Know Your Training ROI?

By Suzanne Boden, Program Coordinator, ESRI Educational Services

Faced with daily media reports of grim economic news, many organizations have cut or eliminated nonessential spending. Often, staff training becomes one of the first casualties. The reasoning may be that training, like a store-bought latte, is considered a luxury that can be done without in lean times.

Undoubtedly, fiscal belt tightening is in order for many of us, at least for the near term, if not the long haul. However, forward-thinking organizations consider relevant training an investment, not a luxury. Similar to a flu shot, training for GIS staff can reduce the likelihood of a high-impact illness (i.e., operational breakdown) down the road, when you least need or expect it. Having a cadre of well-trained staff does not guarantee that nothing will ever go wrong with your GIS program or the business operations that rely on the GIS, but training does instill a measure of confidence that your program is healthy.

Gaining a Return on Instruction

Is it possible to define a training return on investment (ROI)? Or, perhaps we should think in terms of return on instruction. Typical ROI analyses are complex and require many different data from several points in time. Below are some training benefits that, while they have not been measured scientifically for this article, are supported by strong anecdotal evidence based on what our customers tell us. Training will

  • Increase staff efficiency. It is not uncommon to hear students who have learned a single software task in an ESRI instructor-led class excitedly claim they will now save hours on the job.
  • Raise staff productivity. A natural result of increased efficiency, productivity increases when tasks are completed more quickly. More tasks can be completed in less time.
  • Increase staff knowledge. This benefit may seem obvious, but knowledge is more than the sum of the topics covered in a class. Knowledge is the synthesis of different concepts and skills learned over time, which enables a person to recognize and act to prevent errors and reduce liabilities.
  • Lead to new business opportunities. Again, this benefit is a natural extension of the previous benefit. When your employees are well trained, they are free to be creative and see possibilities for information products and workflows that may not have been apparent before the training. Interacting with peers in class by exchanging ideas and experiences certainly helps realize this benefit.

Lee Hartsfield is the Tallahassee-Leon County GIS (TLC GIS) coordinator. Last August, ESRI recognized the work of TLC GIS with the 2008 Special Achievement in GIS Award. Hartsfield sees benefits from hosting ESRI instructor-led courses together with other agencies to jointly train their staff and share costs.

"We have built relationships that are called on time and time again to share knowledge and experience," says Hartsfield.

Invest in People Who Work with GIS

Training is not a cure for an economic crisis, and it will not save a GIS program that has systemic flaws. It can, however, help bolster the bottom line in the long run. Especially in lean times, investing in the people who work with GIS is a good strategy for earning the organizational benefits expected from the GIS.

For Darren Rozenek, GIS administrator for the City of Akron (Ohio) Public Utilities Bureau, ESRI training was invaluable when the city decided to migrate its old shapefile-based system to an enterprise ArcSDE geodatabase.

"With a more effective and streamlined workforce, the city of Akron GIS program is positioned to take full advantage of the GIS technology and fully support the needs of our city and its citizens in the future," Rozenek says.

Read the full article: http://www.esri.com/news/arcwatch/0109/training-roi.html

Thursday, February 05, 2009

ArcGIS Explorer 900 preview

ArcGIS Server / ArcGIS Mobile Code Challenge

ESRI Offers $16,000 in Cash Prizes for the 2009 ArcGIS Server Mashup and ArcGIS Mobile Code Challenges

Redlands, California—ESRI invites developers to share their creativity and expertise with the geographic information system (GIS) developer community by submitting original code samples to the ArcGIS Server Mashup and ArcGIS Mobile Code Challenges at www.esri.com/codechallenge. The first-place prize for the ArcGIS Server Mashup Code Challenge is US$7,000, and the second-place prize is US$3,000. The first-place prize for the ArcGIS Mobile Code Challenge is US$4,000, and the second-place prize is US$2,000.

The ESRI developer community will have an opportunity to review and vote for the top two entries in each challenge based on creativity, applicability, and the relevance of each code sample. Each entry must be a mobile GIS application developed using the ArcGIS Mobile Software Development Kit (SDK) or a Web mashup built with ArcGIS Server SDKs.

Code challenge winners will be announced at the 2009 ESRI Developer Summit, an event for developers who use GIS, mapping, and spatial data. The summit will be held March 23–26, 2009, in Palm Springs, California. Developers will learn the latest GIS technologies and best practices to build, customize, and deploy spatially enabled applications.

These code challenges are open to developers worldwide, including ESRI business partners, provided the applicant or the applicant's organization is a licensed user of ArcGIS Server 9.2, ArcGIS Server 9.3, or a current ESRI Developer Network (EDN) subscriber.

More info: http://www.esri.com/news/releases/09_1qtr/2009_arcgis_code_challenge.html 

Details: http://www.esri.com/codechallenge

Friday, January 30, 2009

“GIS is a Green Technology” – new white paper available

GIS Supports Global Green Initiatives

With the growing unease and awareness among large segments of the population that remedial
action must be taken to resolve the many environmental crises we now face, GIS solutions are
currently being implemented around the world that provide the technological and scientifi c support
necessary to create programs and processes designed to return our planet to a more sustainable
and balanced level of use.

Whether increasing the effi ciency of fl eet vehicles by optimizing standard routes and subsequently
reducing fuel consumption or determining the optimum location for a wind farm to produce energy
with minimal pollution, GIS provides the quantifi ed information and analytical capabilities necessary
to make decisions that can both support growth and reduce consumption.
The visualization capabilities of GIS afford a unique way of examining things that promotes creative
out-of-the-box thinking, providing insight and solutions that are not so apparent in written reports
and tabular data. Often, an existing GIS implementation stimulates the need to modify existing
business practices or apply new ones that lead to savings in both costs and resources.

The stories included in this e-book detail GIS-based applications for innovative, sustainable
solutions to many of today's common environmental problems. Cascade County, Montana, uses
GIS to map the optimum locations for wind farms and promote investment in this "green" energy
source. Buffalo, New York, known as the City of Trees, maintains its urban forest inventory with
GIS. Air pollution in Jakarta, Indonesia, is severe; in 2004, 46 percent of all illness in the city was
respiratory related, but backed by GIS-based scientifi c studies, the government has implemented
an ambitious plan to improve air quality. The release of carbon dioxide (CO2) into the atmosphere
is the fundamental cause of global warming; GIS is being used in the study and implementation of
CO2 sequestration programs, which either capture the pollutant at its source or absorb it through the
planting of vegetation. The U.S. Army Corps of Engineers used GIS to restore the natural habitat
of the Middle Rio Grande in New Mexico, and the City of Boston, Massachusetts, is implementing
an ambitious solar energy program by using GIS to calculate the solar radiation available on city
rooftops.

As ESRI president Jack Dangermond has often said, "The application of GIS is only limited by the
imagination." GIS Is a Green Technology provides an introduction to the powerful capabilities of the
software when applied to environmental and sustainability issues as well as the ingenuity of those
developing these innovative applications.

Get the 50-page PDF here: http://www.esri.com/library/bestpractices/gis-is-green.pdf

GIS for Decision Support and Public Policy Making

Click image for a larger image of GIS for Decision Support and Public Policy Making cover

Elected officials and department heads are increasingly relying on geographic information system (GIS) technology to make efficient and accurate decisions when and where it counts. GIS for Decision Support and Public Policy Making presents twenty-seven case studies and eight exercises that demonstrate the positive impact of incorporating GIS methodology in daily operations of the public sector. Discover how GIS has improved the communication, collaboration, and decision making in the organizations featured in this book. A return on investment (ROI) matrix is also included as a resource to evaluate cost and time savings due to the increased productivity that a GIS allows.

Thursday, January 29, 2009

Funny, Sad and Interesting – all at the same time…

You have got to take a look at this blog posting on GIZMODO – it is…interesting…

Google Maps Car Hits a Deer, Records Entire Ordeal on Google Maps

Maybe not “real time” data – but certainly real!

What's Coming in ArcGIS 9.3.1?

[ ESRI has posted some info about what’s is coming at the 9.3.1 release. For those of you that haven’t heard, 9.3.1 will be released around mid-year 2009. 9.4 is sometime the following year – don’t ask for a more specific date, we don’t have one yet!

Here are the major topic areas – hit the link at the end for more details. ]

High-Performance Dynamic Map Publishing

Better Sharing of Geographic Information

Enhanced Support for Java Developers

Easy to Install

There is also a FAQ.

http://www.esri.com/software/arcgis/whats-new/whats-coming.html