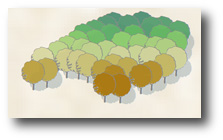
[ This is a little bit different – how to symbolize a stand of trees in ArcMap and have a gradation of colors going through the stand. The result is pretty interesting. ]
We recently got this in an email from an ESRI colleague:
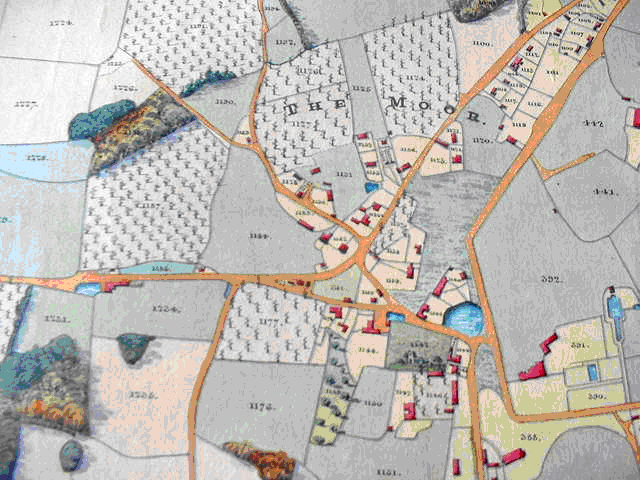
"I went to TOSCA's (The Oxford Seminars in Cartography) Field Trip last night in the Christ Church Library. There were lots of 16th and 17th century maps to be seen. One of the most striking was Frederick Young's Plan of the Parish of Hawkhurst (1818). The way the small woods are depicted and symbolised is fantastic. The symbology of the bushy tree is graded from yellow/brown to green. Can we do this in ArcGIS?"
You can see what he is talking about in this excerpt from the map:
It seemed to me that it might be possible to do this with point features and a modification of some symbology shown in one of our earlier blog entries called Restricted Color Ramp. The trees in this example are point features that were symbolized using character marker symbols. These multi-layer symbols were defined using the ESRI US Forestry 2 font. The top layer is a dark green outline and the bottom is a green fill. We locked the top layer so its color wouldn’t change but for the fill we used a color ramp to give each tree a slightly different color green so that it would look more realistic. In the blog entry, we describe how you can restrict the range of colors that are used from the color ramp. This was done to make sure that the trees were all in the hue of green with different saturation and value levels.
Read the rest in the full post at: http://tinyurl.com/cqttyy


1 comment:
Thanks! this will be incredibly helpful to our readers (land surveyors)
Post a Comment