A collection of various GIS related links, information and other GIS blogs.

Tuesday, March 31, 2009

Tips for Mapping Shorelines

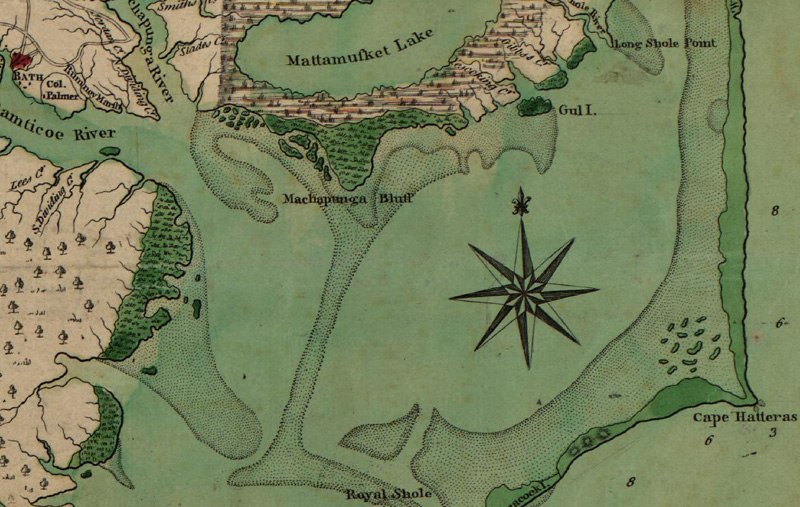
A recent “Ask a Cartographer” question dealt with mapping shorelines to look like the styles found in old-time maps like the example below.

Trees

This Mapping Center post covers multiple ways to symbolize vector and raster data. Good details and lots of graphics.

See the full post here.

What’s the Story on VB6 & VBA ESRI?

I’m glad you asked!

We have been talking about Microsoft dropping support for VB and VBA for some time, but it looks like this was still new news to a lot of folks at the #devsummit.

So here’s some updated information, specifically looking at the 9.3.1 and 9.4 releases and beyond.

Sunday, March 29, 2009

ESRI Developer Summit – Lots of News

The ESRI Developer Summit took place last week in Palm Springs, following right on the heels of the Business Partner Conference.

Like many of you, I was not there. But sometimes I felt like I was just from following all the action on Twitter. Folks were sending a fair number of tweets during the BPC. But it was during the Developer Summit that the Twitter action really took off! Interested in seeing what was discussed? You can follow the hash tag for the Summit - #devsummit.

Keep an eye on the Developer Summit events page on ESRI.com – they have already posted some video, and more will be available in the coming weeks.

There have also been a lot of attendees posting on their blogs about the event:

Another fantastic resource that many of the #devsummit presenters have taken advantage of is the slideshare site. In particular there has been a tag created here for “esri” & one for “devsummit” as well – so you can find all all of the presentations in one place. There is some good stuff here – even without the presenter.

If you know of any blog posts or other interesting Developer Summit related resources that should be listed here, please leave a comment and let me know. Thanks!

Follow me on Twitter @Tim_Craig

Mapping the Seven Sins

Thought you might find this article interesting. It is about the “spatial distribution of the Seven Deadly Sins”. And what an interesting choice of states to focus on for this topic – Nevada!

Take a look HERE for the full article and graphics.

Thursday, March 26, 2009

ESRI / Microsoft Virtual Earth Partnership Announced

This week during the Environmental Systems Research Institute Developer Conference in Palm Springs, CA, ESRI announced their extended partnership with Microsoft’s Virtual Earth business unit granting native access to Virtual Earth’s imagery and road network map data within ArcGIS Desktop and Server. How’s that for a footprint? At the very least it makes the GIS world a bit more interesting, no?

See blog post on MSDN for the official announcement!

Tuesday, March 10, 2009

Wednesday, March 04, 2009

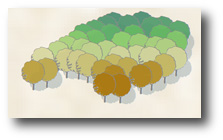
Symbolizing Trees – ESRI Mapping Center

[ This is a little bit different – how to symbolize a stand of trees in ArcMap and have a gradation of colors going through the stand. The result is pretty interesting. ]

http://tinyurl.com/cqttyy
Trees

We recently got this in an email from an ESRI colleague:

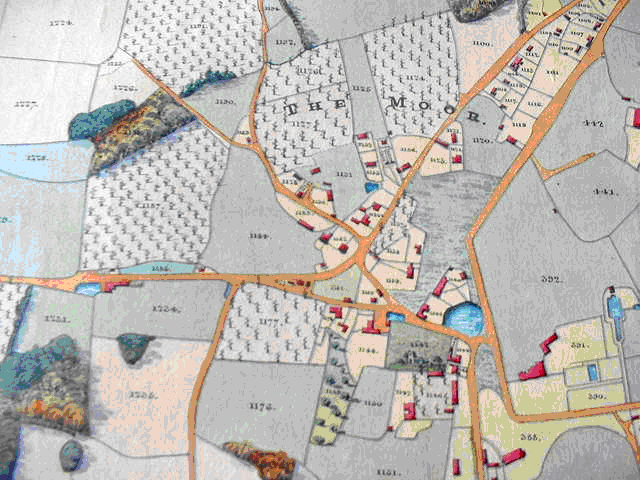
"I went to TOSCA's (The Oxford Seminars in Cartography) Field Trip last night in the Christ Church Library. There were lots of 16th and 17th century maps to be seen. One of the most striking was Frederick Young's Plan of the Parish of Hawkhurst (1818). The way the small woods are depicted and symbolised is fantastic. The symbology of the bushy tree is graded from yellow/brown to green. Can we do this in ArcGIS?"

You can see what he is talking about in this excerpt from the map:
Trees

It seemed to me that it might be possible to do this with point features and a modification of some symbology shown in one of our earlier blog entries called Restricted Color Ramp. The trees in this example are point features that were symbolized using character marker symbols. These multi-layer symbols were defined using the ESRI US Forestry 2 font. The top layer is a dark green outline and the bottom is a green fill. We locked the top layer so its color wouldn’t change but for the fill we used a color ramp to give each tree a slightly different color green so that it would look more realistic. In the blog entry, we describe how you can restrict the range of colors that are used from the color ramp. This was done to make sure that the trees were all in the hue of green with different saturation and value levels.

Read the rest in the full post at: http://tinyurl.com/cqttyy