A collection of various GIS related links, information and other GIS blogs.

Monday, March 22, 2010

Some ArcGIS 10 Tips from Crystal Dorn

Not everyone gets to spend time in Palm Springs at the ESRI Developer Summit (on Twitter @ESRIDevSummit and follow Hashtag #devsummit). Included in that group with you and me is Crystal Dorn from the CA/HI/NV Regional Office (on Twitter @CrystalDorn).

One thing we have seen year after year is that clients love to see Crystal’s Usability Tips & Tricks demos at meetings and conferences. So when she told me she was going to Tweet some tips from ArcGIS 10 (#ArcGIS10) I decided that I would RT them out as well. And for you folks not on Twitter for whatever reason, I thought it might be nice to gather them all up in one blog post too! So here you go…

@CrystalDorn: Love it! Searching for symbols super easy & faster, e.g. "Hazmat RED" lists all hazmat red symbols! #ArcGIS10 

@CrystalDorn: Select by Lasso on the new Selection Tools where have you been my whole ArcMap life? Sometimes it's the little things! #ArcGIS10

@CrystalDorn: ArcMap Table container window lets attribute table be docked side-by-side or opened via tabs - great feature! #ArcGIS10

@CrystalDorn: Woohoo can change edit sketch (vertex, segments, etc.) symbology now in Editor options! #ArcGIS10 

@CrystalDorn: ...and can select multiple vertices! New Edit Vertices toolbar will be a popular feature of #ArcGIS10 

I think Crystal is on the road tomorrow, so probably no new tips. I’ll keep an eye out though, and if she starts up again I will RT and post them here.

Thursday, January 21, 2010

ESRI Tools & Resources for Haiti (& other) Response Efforts

Updated: Jan 21, 2010:

TwitterSearch Flex viewer Widget: http://resources.esri.com/arcgisserver/apis/flex/index.cfm?fa=codeGalleryDetails&scriptID=16782 
The idea for this widget came about at the Random Hacks of Kindness event in CA back in Nov 2009. The BarCamp discussions had a lot of talk about crowd-sourced information, especially Tweets. We weren’t able to complete the code for this widget at the event, but now it is ready for prime time (well, beta prime time). It is a multi-fuction widget in that you can search for Tweets within a draw radius area (like around the island of Haiti), and you can also filter your radius search results by up-to three keywords or hashtags. This widget also allows you to send Tweets, and even better – geo-locate those Tweets. So if you are Tweeting about something happening somewhere else, you can locate the Tweet in that area. Widget is also ready to go in the GEO Viewer. Thanks Andy!

Updated Imagery available via ArcGIS Online:
NOAA imagery (Jan 20): http://www.arcgisonline.com/home/item.html?id=2c570d9fcda24f4085e55bd8d8f1eeda 
Bing Maps, Digital Globe imagery (Jan 18): http://www.arcgisonline.com/home/item.html?id=6e4d40bc81dd4e70b265a4aa22961a79


Updated: Jan 20, 2010:

Accessing OpenStreetMap data within ArcGIS to support the Haiti Earthquake Response: http://blogs.esri.com/Dev/blogs/publicsafety/archive/2010/01/20/Accessing-OpenStreetMap-data-within-ArcGIS-to-support-the-Haiti-Earthquake-Response.aspx 
This post on the ESRI Public Safety blog discusses how you can use OpenStreetMap data in ArcGIS Desktop. With all the work being done on updating these data post-earthquake, this is useful information.

Free Flex Sample viewer: http://resources.esri.com/arcgisserver/apis/flex/index.cfm?fa=codeGalleryDetails&scriptID=15905 
This sample viewer allows you to build a website without needing ArcGIS Server. It hits freely available ArcGIS Online data and allows for some viewer customization via configuration files, so no need to compile code. You can also deploy some of the free widgets available from the Resources pages. Some examples of widgets you may like to include are:
- Twitter Geospatial Search Widget (draw a radius on the map to retrieve geo-located Tweets within that area): http://resources.esri.com/arcgisserver/apis/flex/index.cfm?fa=codeGalleryDetails&scriptID=16448 
- Google Streetview Integrated with AGS Flex API (click on the map to grab Google Streetview at that location): http://resources.esri.com/arcgisserver/apis/flex/index.cfm?fa=codeGalleryDetails&scriptID=16070 

GeoEye Image Service published in the Amazon Cloud: http://events.arcgisonline.com/ArcGIS/rest/services/GeoEye_Haiti_Jan13/ImageServer 
More services: http://events.arcgisonline.com/ArcGIS/rest/services 
January 13 GeoEye imagery as an Image Service for REST, SOAP or WMS access

Tools available from ArcScripts for working with OpenStreetmap data: http://arcscripts.esri.com/scripts.asp?eLang=&eProd=&perPage=10&eQuery=openstreetmap 
Query on ArcScripts for OSM related entries.

Free tools and widgets available for your mapping websites:
- Flex:
http://resources.esri.com/arcgisserver/apis/flex/index.cfm?fa=codeGallery 
- Silverlight:
http://resources.esri.com/arcgisserver/apis/silverlight/index.cfm?fa=codeGallery 
- JavaScript:
http://resources.esri.com/arcgisserver/apis/javascript/arcgis/index.cfm?fa=codeGallery 
- .NET:
http://resources.esri.com/arcgisserver/adf/dotnet/index.cfm?fa=codeGallery 
- Java:
http://resources.esri.com/arcgisserver/adf/java/index.cfm?fa=codeGallery 
These are all part of the user communities for each product. ESRI supports and encourages the sharing of code through these community pages.


Original Post Jan 15, 2010:

Geo Status Widget for Flex Viewer: http://resources.esri.com/arcgisserver/apis/flex/index.cfm?fa=codeGalleryDetails&scriptID=16686
This widget allows you to geo-locate a Tweet. So if you want to reference a Tweet to an event or location without being there, this is one way to do that via clicking on a map to select the location. This widget was developed onsite at the Random Hacks of Kindness event Nov 2009.

ArcGIS Online Haiti Earthquake: http://www.arcgisonline.com/home/group.html?owner=esri_event&title=Haiti%20Earthquake
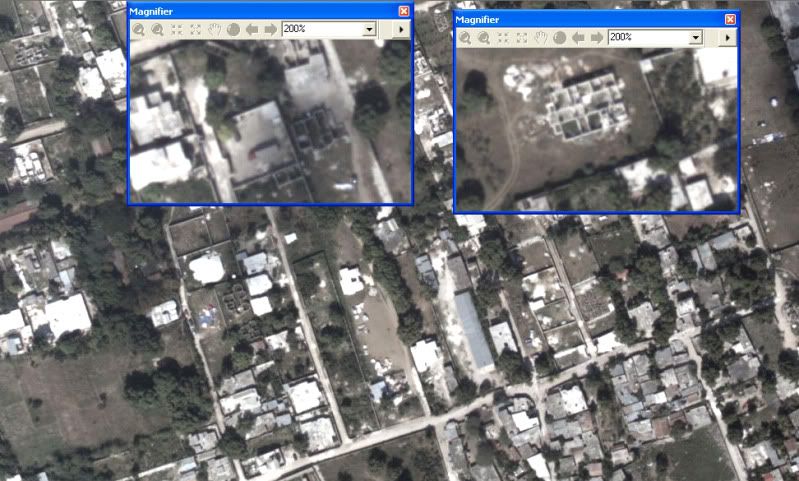
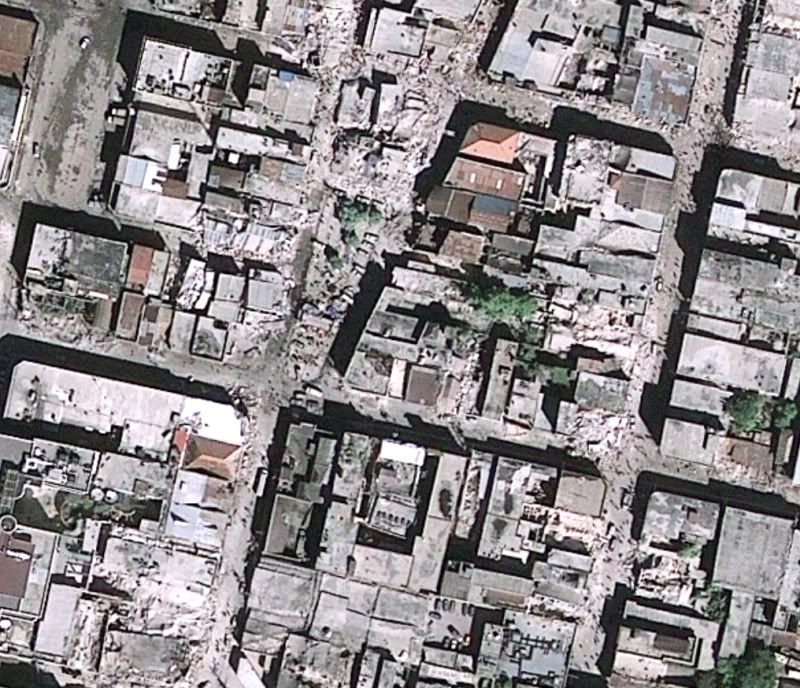
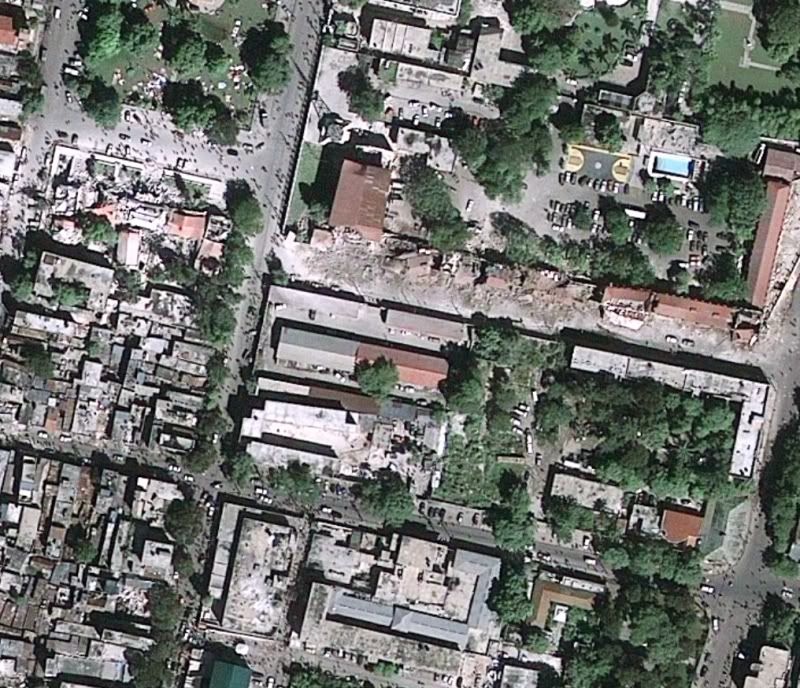
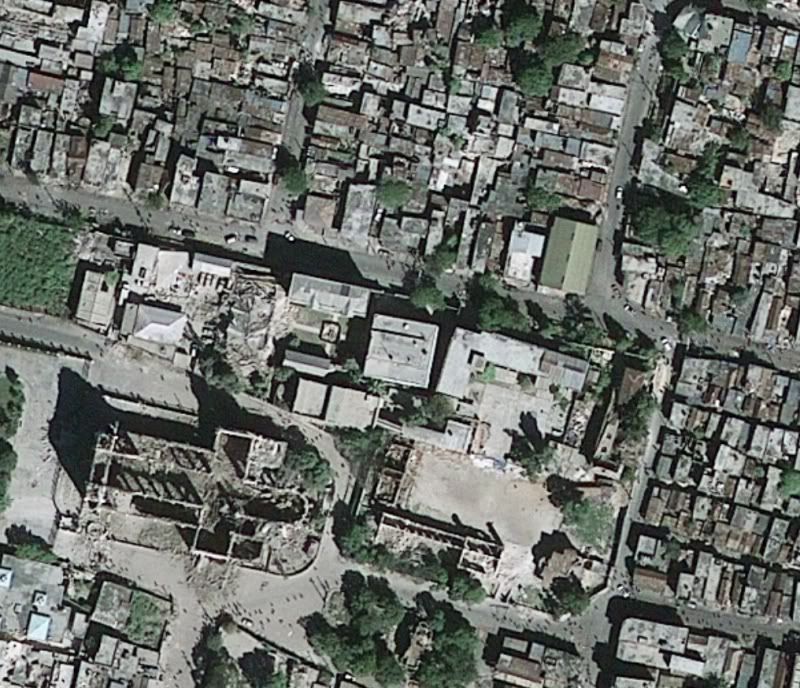
Free data and information related to Haiti and earthquake including post-event imagery from GeoEye (as a layer, in a map document, or as a web app for data download – see samples of imagery below). Click on the Content tab to see what is available. Update 1-20-10: Data are continually being added here. When I first made this post there were 7 items, today there are 24 – keep it coming!

Add Additional Data to ArcGIS Online: http://blogs.esri.com/Support/blogs/arcgisonline/archive/2010/01/15/adding-content-to-arcgis-online.aspx 
So you have access to some data or maps related to the Haiti Quake and are wondering how you can share it? The post linked above steps you through the process with ArcGIS Online.

Geoss Viewer: http://geoss.esri.com/geoviewer/
Follow Tweets within a drawn radius area, display geoRSS feeds from USGS and other groups, compute population within drawn area, and more.

Disaster Response and Assistance: http://www.esri.com/services/disaster-response/earthquakes/index.html 
Free temporary software, data, imagery technical support and other resources to help people supporting the disaster response and recovery efforts in Haiti.

Web APIs free for non-commercial use: http://resources.esri.com/arcgisserver/index.cfm?fa=applications 
These web API’s allow you to pull data from the Cloud and mash it up with other sources of data. Pick your flavor – Flex, Silverlight, JaveScript, .NET, or Java.

ArcGIS Online data for Desktop use or Web use – no cost for non-commercial use (Standard services): http://www.esri.com/software/arcgis/arcgisonline/map-services.html 
Imagery, streets, political, etc – global data

World Geocoding and World Routing available as Task Services – no-cost for non-commercial use: http://www.esri.com/software/arcgis/arcgisonline/task-services.html 
Use in ArcGIS Desktop or free web mapping APIs


Sample images from GeoEye imagery of Haiti, post Jan 2010 earthquake (click for larger image)

Monday, January 11, 2010

This One’s a 10

ESRI made an announcement late today, and word has spread fast. 9.4 has been renamed to be version 10.

Here is the official announcement as a podcast from Jack, where he describes why this decision was made and he discusses some of the features included in 10 and why it justified a full version number. http://www.esri.com/news/podcasts/audio/speaker/dangermond_arcgis10.mp3 

Listen to the podcast, and also view the What’s Coming page for ArcGIS 10: http://www.esri.com/software/arcgis/whats-new/whats-coming.html 

From the traffic I’ve seen on Twitter a number of folks have blogged on this topic already, and it seems that no one is shocked or too questioning this version number change. Lots of good stuff in version 10.

The beta program is still open – talk to your ESRI representative for more information.

Some other blogs posts to review (I’m sure there will be many more tomorrow):

http://blog.gisuser.com/?p=5891&utm_source=twitterfeed&utm_medium=twitter 

http://www.spatiallyadjusted.com/2010/01/11/arcgis-9-4-is-now-arcgis-10/ 

http://geo.geek.nz/esri/arcgis-9-4-renamed-arcgis-10/

Wednesday, December 09, 2009

Bye Bye Geography Network

After a nine-year run, the Geography Network will be closing up shop at the end of 2009.

With so much data on ArcGIS Online with multiple ways to access it and so many other web services available, ESRI has decided the time has come to shut it down.

Here’s the blog post about it: http://blogs.esri.com/Support/blogs/arcgisonline/archive/2009/12/09/geography-network-to-retire.aspx

Thursday, August 20, 2009

DEPRECATION PLAN FOR ARCGIS 9.3.1 AND ARCGIS 9.4

It is time to start thinking about your back-end systems and development environments and OS’s and…

New document just released to the ESRI Support pages that discusses platform changes at the current 9.3.1 release, and the next release – 9.4.

It will be interesting to see what parts of the changes at 9.4 get the most interest (Noise? Worry? Joy?) from clients, and also in the social networking realm – especially Twitter.

See Technical Article 37113 for more details.

Friday, May 22, 2009

What’s a GIS Developer To Do @ UC??

Are you a GIS Developer (or hope to be one when you grow up?)?

Are you going to be at the User Conference this year?

Are you looking at the ginormous UC agenda and getting eye strain?

Not sure what to search for in the Online Agenda?

Fear no more – your friends at the ArcGIS Developer Blog have done the heavy lifting for you!

They have boiled down the agenda and come up with this Road Map for the 2009 User Conference, focusing on workshops and sessions that are focused on topics that you, as a GIS Developer, might be interested in. Looks like they missed the Thursday Night Party and the Map Gallery Opening – but you all don’t care about those social events do you?  =)

Hope you have a great time at the UC – tons of fun and a lot to learn.

ArcGIS Developers: Road Map for the 2009 User Conference

Map Templates Resource Center

You might be interested in reviewing what is now available at the ESRI Resource Centers Map Template Gallery.

As described in this blog post on the Mapping Center blog, these templates are not simply an MXT as you might expect. These templates are ZIP files that include an example map (.MXD) so you can see how a map was made, some sample data so you can see the structure of the data, and documentation as well so that all levels of GIS users will know where to start and what tasks are needed. Some of the templates will also include things like GP tools/models or maybe an example web app and code.

Take a look – currently I am seeing templates for Topo at varying scales, Geologic, Street Map, and Reference Map. Hopefully we will see all of you out there in the Community begin to add your template examples as well!

Tuesday, May 19, 2009

Tweet Tweet

Been using Twitter now for a few months. “Micro-Blogging” yet so very different from a blog. Been through a few desktop applications to better my Twitter experience, but was still using http://twitter.com when out and about on my Windows Mobile device. I knew there had to be something better.

Where to turn? To Twitter of course! I had seen folks Tweeting about different applications for the Blackberry – then did see a series of Tweets about Windows Mobile – this is where I learned about Twikini.

So I grabbed the beta and liked it right away. Easy to use, and code updates often with new features. I’m really liking it. Be sure to check out the menus as there are lots of features in there. Also see the main features here.

You can even add your location information to your Tweets:

image

If you are on Twitter and have a Windows Mobile device, I recommend that you take a look at Twikini. Oh ya – if you are interested in following me, I am @Tim_Craig

Friday, May 01, 2009

Jack Interview-O-Rama

Lots of interviews with Jack Dangermond, Founder and President of ESRI this week.

Government Technology (GovTech) - http://www.govtech.com/gt/articles/652976 

O’Reilly radar had a three-part interview:
Part 1 of 3: Web Mapping
Part 2 of 3: Sharing Government GIS Data
Part 3 of 3: The GeoWeb

Monday, April 13, 2009

GIS in the Survey World

Brent Jones from ESRI delivering the keynote address “Why GIS Needs Land Surveyors” at the 2nd annual Carlson User Conference (2009).

Tuesday, March 31, 2009

Tips for Mapping Shorelines

A recent “Ask a Cartographer” question dealt with mapping shorelines to look like the styles found in old-time maps like the example below.

Trees

This Mapping Center post covers multiple ways to symbolize vector and raster data. Good details and lots of graphics.

See the full post here.

What’s the Story on VB6 & VBA ESRI?

I’m glad you asked!

We have been talking about Microsoft dropping support for VB and VBA for some time, but it looks like this was still new news to a lot of folks at the #devsummit.

So here’s some updated information, specifically looking at the 9.3.1 and 9.4 releases and beyond.

Sunday, March 29, 2009

ESRI Developer Summit – Lots of News

The ESRI Developer Summit took place last week in Palm Springs, following right on the heels of the Business Partner Conference.

Like many of you, I was not there. But sometimes I felt like I was just from following all the action on Twitter. Folks were sending a fair number of tweets during the BPC. But it was during the Developer Summit that the Twitter action really took off! Interested in seeing what was discussed? You can follow the hash tag for the Summit - #devsummit.

Keep an eye on the Developer Summit events page on ESRI.com – they have already posted some video, and more will be available in the coming weeks.

There have also been a lot of attendees posting on their blogs about the event:

Another fantastic resource that many of the #devsummit presenters have taken advantage of is the slideshare site. In particular there has been a tag created here for “esri” & one for “devsummit” as well – so you can find all all of the presentations in one place. There is some good stuff here – even without the presenter.

If you know of any blog posts or other interesting Developer Summit related resources that should be listed here, please leave a comment and let me know. Thanks!

Follow me on Twitter @Tim_Craig

Mapping the Seven Sins

Thought you might find this article interesting. It is about the “spatial distribution of the Seven Deadly Sins”. And what an interesting choice of states to focus on for this topic – Nevada!

Take a look HERE for the full article and graphics.

Thursday, March 26, 2009

ESRI / Microsoft Virtual Earth Partnership Announced

This week during the Environmental Systems Research Institute Developer Conference in Palm Springs, CA, ESRI announced their extended partnership with Microsoft’s Virtual Earth business unit granting native access to Virtual Earth’s imagery and road network map data within ArcGIS Desktop and Server. How’s that for a footprint? At the very least it makes the GIS world a bit more interesting, no?

See blog post on MSDN for the official announcement!

Tuesday, March 10, 2009

Wednesday, March 04, 2009

Symbolizing Trees – ESRI Mapping Center

[ This is a little bit different – how to symbolize a stand of trees in ArcMap and have a gradation of colors going through the stand. The result is pretty interesting. ]

http://tinyurl.com/cqttyy

Trees

We recently got this in an email from an ESRI colleague:

"I went to TOSCA's (The Oxford Seminars in Cartography) Field Trip last night in the Christ Church Library. There were lots of 16th and 17th century maps to be seen. One of the most striking was Frederick Young's Plan of the Parish of Hawkhurst (1818). The way the small woods are depicted and symbolised is fantastic. The symbology of the bushy tree is graded from yellow/brown to green. Can we do this in ArcGIS?"

You can see what he is talking about in this excerpt from the map:

Trees

It seemed to me that it might be possible to do this with point features and a modification of some symbology shown in one of our earlier blog entries called Restricted Color Ramp. The trees in this example are point features that were symbolized using character marker symbols. These multi-layer symbols were defined using the ESRI US Forestry 2 font. The top layer is a dark green outline and the bottom is a green fill. We locked the top layer so its color wouldn’t change but for the fill we used a color ramp to give each tree a slightly different color green so that it would look more realistic. In the blog entry, we describe how you can restrict the range of colors that are used from the color ramp. This was done to make sure that the trees were all in the hue of green with different saturation and value levels.

Read the rest in the full post at: http://tinyurl.com/cqttyy

Friday, February 27, 2009

Map Use, the Quintessential Book on How to Read and Analyze Maps – ESRI Press

New book from ESRI Press.

"Map Use was written for people who want to use maps to better understand not only the physical environment but the human, social, political, and economic environments as well," says A. Jon Kimerling, the book's co-author and interim chairman of the Department of Geosciences at Oregon State University in Corvallis. "This sixth edition takes readers beyond the graphic symbols that comprise maps and into cartographers' decision-making processes to give them the insights they need to better use maps."

Read more about it: http://tinyurl.com/cpqroa

Tip on Curved Annotation Editing

Tip from Charlie Frye on a shortcut to editing curved annotation in ArcMap:

http://blogs.esri.com/Support/blogs/mappingcenter/archive/2009/01/30/tip-for-editing-curved-annotation.aspx

Tuesday, February 24, 2009

What I wish I had known about ModelBuilder before I started using it – ESRI Mapping Center

[ This is a nice list of things (13 of them) you might not know about ModelBuilder that will make your life easier when using it. Always nice to have Tip & Tricks in one place to find!  - full post at: http://blogs.esri.com/esri/arcgis/2009/02/20/10-things-i-wish-i-had-known-about-model-builder-before-i-started-using-it/ ]
We’ve been compiling a list of "What I wish I had known about ModelBuilder before I started using it". Here are a few things that made the list:
  1. Create personalized tools in ModelBuilder: Until a few days ago, I thought the ModelBuilder editing window (the one that you access when you right click a model that you made adn select Edit) was the only environment I could interact with. For years, I dragged and dropped folders and features into the tools of the ModelBuilder editing window before clicking the black triangle to run the processes. Recently I discovered that ModelBuilder is the editing environment to create a custom tool from existing tools and personalized parameters and conditions. But then when you double click the tool in the ArcToolbox window, you get right into the user interface for the tool.
  2. Controlling the flow: Setting preconditions and parameters in ModelBuilder guarantees that the geoprocessing operations will run in the correct order. For example, I wanted to create a tool that projected a dataset into a new personal database, which I set as a parameter of my model. Before projecting the feature dataset, the new personal geodatabase had to be created. I relayed this information to ModelBuilder by right clicking the Project tool and setting the new personal geodatabase as a precondition. I also had several other parameters in my model, including a coordinate system and a geographic transformation method. Since the geographic transformation depends on the selected coordinate system, I set the coordinate system as a parameter before I set the geographic transformation method as a parameter.
  3. In-line variable substitution: In-line variable substitution is useful if you have a model parameter that serves as a precondition to another process in your model. Using the example above, I wanted to create a tool that projected a dataset into a new personal database, which I set as a parameter. The name and location of the new personal geodatabase is only defined when the model is run, so I had to use in-line variable substitution to parse the processes together within the same model. With a precondition set on the new personal geodatabase, the output notation for the projected dataset is %new personal geodatabase%\ProjectedDatasetName. Note that the new personal geodatabase name is enclosed with the percent signs (%new personal geodatabase%).
  4. Editing tool documentation: The tool and parameter descriptions for a model can be edited in ArcMap by right-clicking the model and selecting Edit Documentation. You can add as much information about the tool/model as you like. The most useful documentation for me is the Abstract and Parameters Dialog Reference. The Abstract allows you to fill in information about what the tool does. The Parameters Dialog Reference allows you to fill in information about the parameters and can be populated by selecting Dialog Reference under the parameter name. You can then click one of the icons to add paragraphs, links, illustrations, code and formatting options. You can also documentation for the parameter by right clicking the tool in the Model Builder window and selecting Edit Documentation. Remember to click Finish or OK when you are done editing. Now, when you double-click your model, you will see the Abstract and the content that you added for each parameter of the model.
  5. Model environments and overrides: There are three places to where you can set your model Environments. One is at the ArcToolbox level, another is at the model/tool level, and the third is at the process level. The Environments setting at the process level in ModelBuilder will override the Environments setting at the model/tool level. The Environments setting at the Model/Tool level will override the default at the ArcToolbox level. This gives you the flexibility to define general Environment settings for the majority of processes in your model, but tailor specific settings to specific processes
  6. Current workspace: This is the directory from which inputs are taken and into which outputs are placed. If you set this (right click the tool in ArcToolbox, click Properties, click on the Environments tab, click General Settings, click Current Workspace and point to the directory you want to use), then your tool will automatically point to the same directory every time so you don’t have to keep navigating to the location. When I create a new tool, I also create a "Tooldata" folder in the directory that stores my tool. It contains some sample data which, when I set it as my Current Workspace, is used as input and it is where the outputs of the model will be placed. That way the tool knows where the data for inputs and the location for outputs should be.
  7. Intermediate data: When you run a model, output data is created for each process in the model. Some of the data created is of no use after the model is run since it was only created to connect to another process that creates new output – this is called “intermediate data”. To set a data variable to be intermediate, right-click the data variable and check the option to set it as intermediate data. If it is intermediate data, it will be written to the scratch workspace.
  8. Scratch workspace: This is the directory for temporary storage of execution results that are created with an auto-generated name. As with the Current Directory, when I create a new tool, I also create a “Scratch” folder in the directory that stores my tool and the Tooldata folder. I set this as my Scratch Workspace. That way the tool knows where the temp files should be placed. This way I can easily delete them or use the model to delete them when I am done with the processing.
Hit the site to view the rest – 13 total when I posted this (link updated July 7, 2012): http://blogs.esri.com/esri/arcgis/2009/02/20/10-things-i-wish-i-had-known-about-model-builder-before-i-started-using-it/