In 2007 there were multiple fires burning in the San Diego region. These fires caused a lot of confusion and fear, as well as being the reason for one of the largest evacuations ever in the state.
Below is a quick map of the various fires that burned in the region. Collectively these are known as the 2007 Firestorm.
View Larger Map
During the month of October, which most people think of as wet wintertime, we get seasonal santa ana winds in the region. These are dry, warm winds that blow from the east over the desert, instead of the prevailing winds from the west over the ocean. These winds, along with high heat and dry conditions, combine to create the worst time for potential fires in the region.
Showing posts with label Emergency Response. Show all posts
Showing posts with label Emergency Response. Show all posts
Monday, January 28, 2013


Thursday, January 21, 2010
ESRI Tools & Resources for Haiti (& other) Response Efforts
Updated: Jan 21, 2010:
TwitterSearch Flex viewer Widget: http://resources.esri.com/arcgisserver/apis/flex/index.cfm?fa=codeGalleryDetails&scriptID=16782
The idea for this widget came about at the Random Hacks of Kindness event in CA back in Nov 2009. The BarCamp discussions had a lot of talk about crowd-sourced information, especially Tweets. We weren’t able to complete the code for this widget at the event, but now it is ready for prime time (well, beta prime time). It is a multi-fuction widget in that you can search for Tweets within a draw radius area (like around the island of Haiti), and you can also filter your radius search results by up-to three keywords or hashtags. This widget also allows you to send Tweets, and even better – geo-locate those Tweets. So if you are Tweeting about something happening somewhere else, you can locate the Tweet in that area. Widget is also ready to go in the GEO Viewer. Thanks Andy!
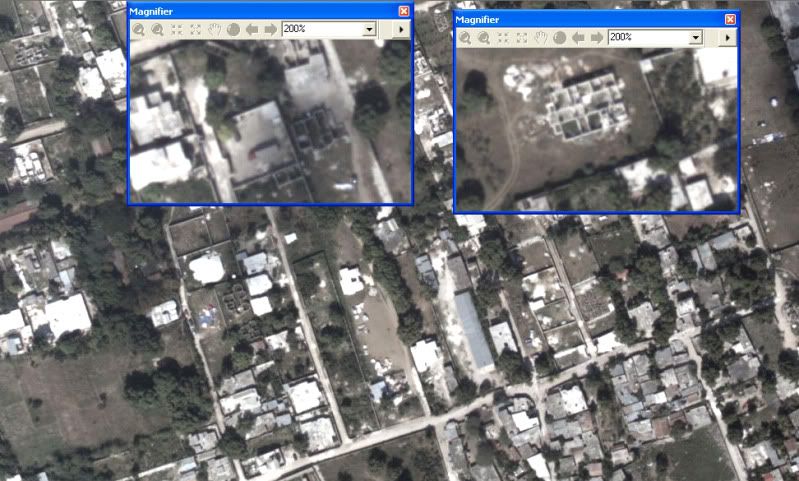
Updated Imagery available via ArcGIS Online:
NOAA imagery (Jan 20): http://www.arcgisonline.com/home/item.html?id=2c570d9fcda24f4085e55bd8d8f1eeda
Bing Maps, Digital Globe imagery (Jan 18): http://www.arcgisonline.com/home/item.html?id=6e4d40bc81dd4e70b265a4aa22961a79
Updated: Jan 20, 2010:
Accessing OpenStreetMap data within ArcGIS to support the Haiti Earthquake Response: http://blogs.esri.com/Dev/blogs/publicsafety/archive/2010/01/20/Accessing-OpenStreetMap-data-within-ArcGIS-to-support-the-Haiti-Earthquake-Response.aspx
This post on the ESRI Public Safety blog discusses how you can use OpenStreetMap data in ArcGIS Desktop. With all the work being done on updating these data post-earthquake, this is useful information.
Free Flex Sample viewer: http://resources.esri.com/arcgisserver/apis/flex/index.cfm?fa=codeGalleryDetails&scriptID=15905
This sample viewer allows you to build a website without needing ArcGIS Server. It hits freely available ArcGIS Online data and allows for some viewer customization via configuration files, so no need to compile code. You can also deploy some of the free widgets available from the Resources pages. Some examples of widgets you may like to include are:
- Twitter Geospatial Search Widget (draw a radius on the map to retrieve geo-located Tweets within that area): http://resources.esri.com/arcgisserver/apis/flex/index.cfm?fa=codeGalleryDetails&scriptID=16448
- Google Streetview Integrated with AGS Flex API (click on the map to grab Google Streetview at that location): http://resources.esri.com/arcgisserver/apis/flex/index.cfm?fa=codeGalleryDetails&scriptID=16070
GeoEye Image Service published in the Amazon Cloud: http://events.arcgisonline.com/ArcGIS/rest/services/GeoEye_Haiti_Jan13/ImageServer
More services: http://events.arcgisonline.com/ArcGIS/rest/services
January 13 GeoEye imagery as an Image Service for REST, SOAP or WMS access
Tools available from ArcScripts for working with OpenStreetmap data: http://arcscripts.esri.com/scripts.asp?eLang=&eProd=&perPage=10&eQuery=openstreetmap
Query on ArcScripts for OSM related entries.
Free tools and widgets available for your mapping websites:
- Flex: http://resources.esri.com/arcgisserver/apis/flex/index.cfm?fa=codeGallery
- Silverlight: http://resources.esri.com/arcgisserver/apis/silverlight/index.cfm?fa=codeGallery
- JavaScript: http://resources.esri.com/arcgisserver/apis/javascript/arcgis/index.cfm?fa=codeGallery
- .NET: http://resources.esri.com/arcgisserver/adf/dotnet/index.cfm?fa=codeGallery
- Java: http://resources.esri.com/arcgisserver/adf/java/index.cfm?fa=codeGallery
These are all part of the user communities for each product. ESRI supports and encourages the sharing of code through these community pages.
Original Post Jan 15, 2010:
Geo Status Widget for Flex Viewer: http://resources.esri.com/arcgisserver/apis/flex/index.cfm?fa=codeGalleryDetails&scriptID=16686
This widget allows you to geo-locate a Tweet. So if you want to reference a Tweet to an event or location without being there, this is one way to do that via clicking on a map to select the location. This widget was developed onsite at the Random Hacks of Kindness event Nov 2009.
ArcGIS Online Haiti Earthquake: http://www.arcgisonline.com/home/group.html?owner=esri_event&title=Haiti%20Earthquake
Free data and information related to Haiti and earthquake including post-event imagery from GeoEye (as a layer, in a map document, or as a web app for data download – see samples of imagery below). Click on the Content tab to see what is available. Update 1-20-10: Data are continually being added here. When I first made this post there were 7 items, today there are 24 – keep it coming!
Add Additional Data to ArcGIS Online: http://blogs.esri.com/Support/blogs/arcgisonline/archive/2010/01/15/adding-content-to-arcgis-online.aspx
So you have access to some data or maps related to the Haiti Quake and are wondering how you can share it? The post linked above steps you through the process with ArcGIS Online.
Geoss Viewer: http://geoss.esri.com/geoviewer/
Follow Tweets within a drawn radius area, display geoRSS feeds from USGS and other groups, compute population within drawn area, and more.
Disaster Response and Assistance: http://www.esri.com/services/disaster-response/earthquakes/index.html
Free temporary software, data, imagery technical support and other resources to help people supporting the disaster response and recovery efforts in Haiti.
Web APIs free for non-commercial use: http://resources.esri.com/arcgisserver/index.cfm?fa=applications
These web API’s allow you to pull data from the Cloud and mash it up with other sources of data. Pick your flavor – Flex, Silverlight, JaveScript, .NET, or Java.
ArcGIS Online data for Desktop use or Web use – no cost for non-commercial use (Standard services): http://www.esri.com/software/arcgis/arcgisonline/map-services.html
Imagery, streets, political, etc – global data
World Geocoding and World Routing available as Task Services – no-cost for non-commercial use: http://www.esri.com/software/arcgis/arcgisonline/task-services.html
Use in ArcGIS Desktop or free web mapping APIs
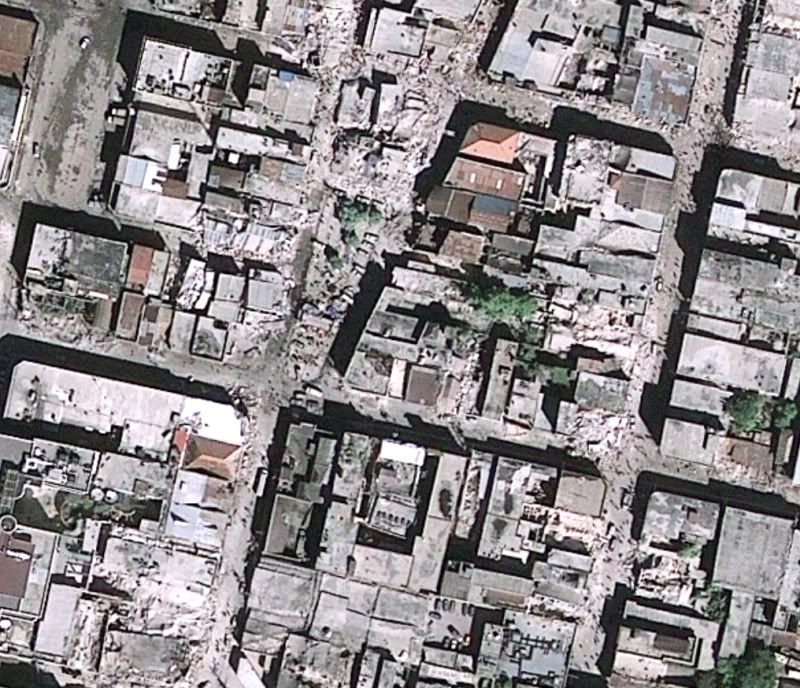
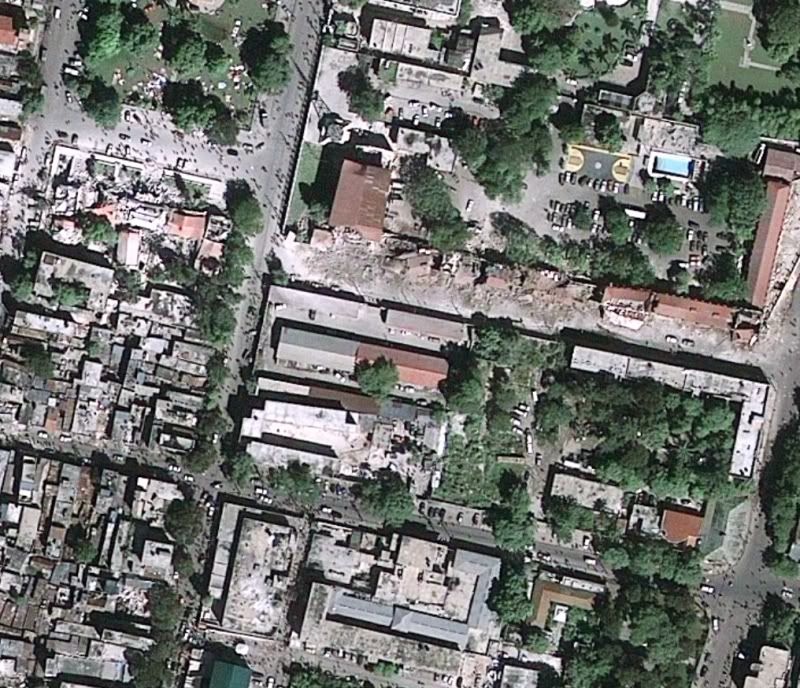
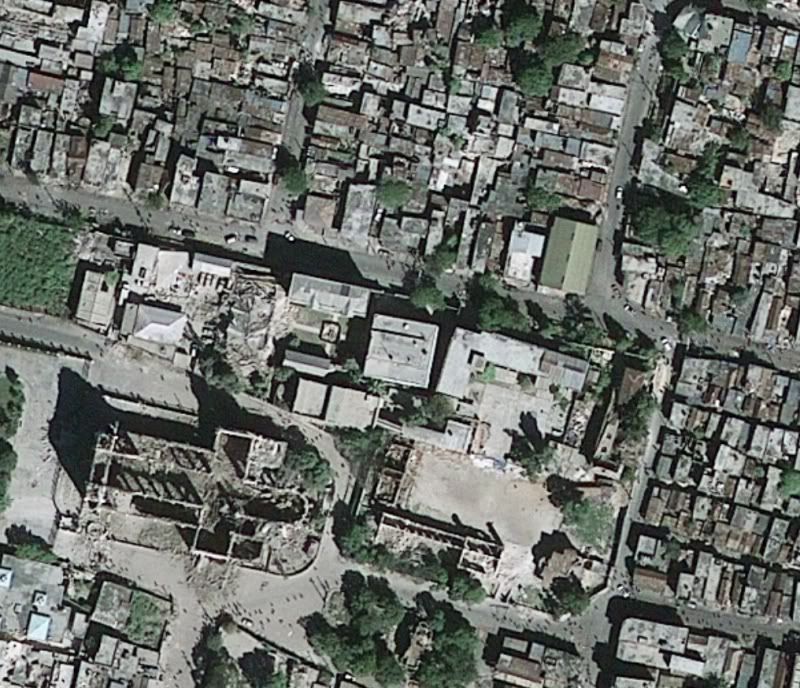
Sample images from GeoEye imagery of Haiti, post Jan 2010 earthquake (click for larger image)
Thursday, February 12, 2009
ArcGIS for Situational Awareness
In case you haven’t seen this new page on the ESRI website:
http://www.esri.com/software/arcgis/situational-awareness/index.html
Friday, November 21, 2008
What’s Shakin’?
Golden Guardian took place recently in California. It simulated a big quake as an opportunity for agencies to test their emergency preparedness and also to see if/how they could work together. In San Diego Caltrans District 11 was out with mobile units gathering information of “damaged” roadways and bridges that needed repair or inspection. This field collected data was transmitted up to Sacramento and loaded up into ArcGIS Server based webservices along with data from other agencies around the state. San Diego County EOC was one such agency.
Cities and counties were then able to consume these webservices in their own applications, in Common Operating Picture viewers based on the ArcGIS Server flex API, or in ArcGIS Explorer.
When the fires started breaking out in southern California (Freeway, Sayre, and Tea) before the exercise was complete, they re-tasked servers, loaded in real emergency information gathered at the fires and kept on serving it up to end users fighting the fires and making decisions on how to allocate resources.
-------------------------------------
November 17, 2008
GIS Delivers during the Largest Earthquake Drill in U.S. History
ESRI Provides Staff and Resources for the Great Southern California ShakeOut
Images for Publication

A GIS-based common operating picture provides continuous data updates. Understanding hospital occupancy levels helps officials direct emergency medical service crews transporting new patients.
Redlands, California—At 10:00 a.m. on November 13, 2008, millions of people throughout Southern California participated in the Great Southern California ShakeOut Drill, the largest earthquake preparedness exercise in U.S. history. The drill simulated a magnitude 7.8 earthquake along the San Andreas Fault in Southern California. ESRI supported participating agencies with software, staffing, and resources used during the exercise, which modeled assessment, rescue, relief, and recovery efforts. Geographic information system (GIS) technology was used to help build an accurate, continuously updated emergency information repository; aided decision support and resource management; and enhanced multijurisdictional communication.
"We worked diligently to create a realistic exercise that helps us see where we are with our response capability in the event of a major earthquake," says John Ellison, agency technology officer and geographic information officer (GIO)/California Environmental Resources Evaluation System (CERES) director, California Resources Agency. "By upgrading to ArcGIS Server 9.3 and ArcGIS API for Flex, we have an easy-to-use Web-based viewer suitable for this purpose. We are very pleased with our GIS experience including during the exercise."
The ShakeOut kick-started a weeklong collection of exercises called the Golden Guardian 2008, held November 13–18 and involving 5,000 participants from public agencies around the state. Based on scientists' predictions of what would occur during and after a major earthquake, the simulated results included 1,800 dead, 50,000 injured, and $200 billion in damages. The goal of the drill was to test and evaluate processes, equipment, technologies, and shared workflows. Results helped determine best practices, opportunities for improvement, and potential new capabilities.
"The GIS platform developed for the Golden Guardian 2008 exercise proved to be an invaluable tool," says Paul Hardwick, GIS project manager, San Diego Homeland Security Regional Technology Center. "We were able to post pertinent information to provide situational awareness to the state emergency command center and affected communities as well as areas adjacent to the disaster. The ability to transfer information between systems and to implement server-based tasks for analysis helped make the event a success."
Multiple Emergency Operations Centers (EOCs), including California Resources Agency, deployed ESRI's Situational Awareness Bundle for the ShakeOut. The bundle provides a complete framework for geospatial intelligence analysis, visualization, and management. Users managed multiple events with the bundle's ready-to-operate hardware solution, its powerful data fusion and analysis engine, and a set of fully customizable viewers to display the affected areas. Staff also used terabytes of prerendered data including street networks, raster imagery, topographic maps, shaded relief imagery, and elevation data.
GIS helped collect and manage large volumes of diverse data including simulated damaged buildings, roads, and power and water infrastructure; affected populations; delivered supplies; and the deployment of fire, emergency medical services, law enforcement, and homeland security staff. Live data, such as weather updates, video, and Global Positioning System (GPS) information, was streamed into the GIS database and disseminated to individuals using desktop computers, mobile devices, and Web-enabled laptops. Mobile GIS helped field crews collect remotely sensed data that was automatically sent back to the comprehensive spatial database.
The ShakeOut was organized by the Earthquake Country Alliance (ECA), a partnership of earthquake professionals, emergency responders, business leaders, and community activists. The group has been planning the ShakeOut since 2006.
Tuesday, March 11, 2008
San Diego emergency dispatchers to handle Chula Vista calls
CHULA VISTA – Fire and medical dispatch calls for Chula Vista will soon be handled by dispatchers in San Diego under an arrangement officials say will save money and improve response times to emergency calls.
San Diego Mayor Jerry Sanders and Chula Vista Mayor Cheryl Cox announced the partnership, which begins March 4, at a Chula Vista fire station Wednesday.
“This is another key step forward to regionalizing emergency response services,” Sanders said. “All in all, this is just a great opportunity for both cities.”
Officials said the system will allow San Diego and Chula Vista to communicate instantly, rather than having to pass information through multiple dispatch centers. Both cities will benefit by sharing resources including fire engines, ladder trucks, brush engines and personnel, officials said.
Chula Vista decided to outsource its fire dispatch in December to save money as part of $15.5 million in budget reductions.
The city's dispatch center costs $1.2 million a year to operate, employing 11 dispatchers. Under the outsourcing contract, Chula Vista will pay San Diego $420,000 a year for five years. The net savings is $780,000 a year.
San Diego now provides dispatch service to 47 fire stations within San Diego and three within Poway, handling calls for an estimated 108,500 incidents a year.
Chula Vista's nine fire stations respond to 15,400 incidents a year. San Diego plans to hire four dispatchers to handle the additional workload.
San Diego emergency dispatchers to handle Chula Vista calls
----------------
San Diego Fire-Rescue makes use of Computer Aided Dispatch software from local firm TriTech.
Road centerline data are maintained by staff at SanGIS with oversight and review by the City of San Diego Fire-Rescue.
Wednesday, March 05, 2008
Press Release -- ESRI Recognizes San Diego County Officials for GIS Work during Wildfires
ESRI Recognizes San Diego County Officials for GIS Work during Wildfires
GIS Use Improved Communications, Saved Infrastructure, and Assisted in Evacuations
Redlands, California—San Diego County officials were recently recognized for their work using geographic information system (GIS) software behind the scenes during recent wildfires that consumed tens of thousands of acres in Southern California this past fall. ESRI, the world's leading GIS software company, presented Paul Hardwick, GIS unit leader, Office of Emergency Services, with the Making a Difference Award at the ESRI California Regional User Group Meeting held in Sacramento, California, last month. This award is given to people and organizations that use GIS in exceptional ways.
During the 2007 fires, Hardwick and his team used ESRI software to manage a wide range of data and create maps that were critical for directing strategic operations. "Paul's team epitomizes ESRI's vision of how people can use technology to more effectively and responsively run their organizations," says Jack Dangermond, president, ESRI. "They are using it to serve the community in the best ways possible. Their efforts during the San Diego fires were exemplary; lives and property were saved because they had the foresight to apply their past experiences to this crisis, making a significant impact on the outcome of the fires."
GIS is a computer software technology that links geography to information, giving users a much clearer picture of data and allowing many types of analysis to be done. During the fires, this technology helped officials monitor fire activities and share essential information among response agencies and with the public. "With five major fires burning throughout the county, the timely and detailed maps our GIS team was able to produce were critical in our ability to not only coordinate our emergency responders but also provide critical information to the public," says Ron Lane, director of the San Diego County Office of Emergency Services. "The GIS maps we provided to the media and on our Web site were instrumental in helping citizens make the life-or-death decision of whether to evacuate."
"It was rewarding to see ArcGIS being used in real time to aid in the decision-making process throughout this emergency including in the policy room at the Emergency Operations Center," says Tim Craig, ESRI account executive for the San Diego area. "The county's work on a standard operating procedure [SOP] in the wake of the 2003 wildfires led to the efficient use of resources at all levels, from staffing and data capture to analysis and even to plotter paper. The maps being produced showed what was happening in the entire region and served as useful public notification tools. They were ready this time, and it showed in their well-coordinated response effort."
Communication among departments and organizations was much improved with the county's GIS, since the software integrates different information technology systems by ensuring the data is consistent. "GIS-based predictive modeling and mapping led to the evacuation of 2,100 medically fragile, special-needs individuals as well as the containment and removal of hazardous waste before the fire became a danger," says Hardwick. "Using GIS helped us communicate in a more timely and accurate fashion to both the public and other agencies. GIS was instrumental in forming a common understanding of events between all parties involved."
Evacuating people from their homes is not a simple or inexpensive task; using the county's GIS, which combined evacuation data with county demographic data, helped decision makers better understand the true number of people evacuated—an overwhelming 515,000—and their underlying characteristics. "The county developed reentry and recovery plans and assessed the impact of the fires in a remarkable way," says Nate Johnson, manager, California-Hawaii-Nevada region, ESRI. "GIS map images allowed county staff to assess damage to property, assets, and habitat even while the wildfires were still burning. Using a geographic approach to forecast the effects from the fires made it easier to see how best to prioritize efforts in the aftermath of the disaster. Maps provided immediate and vital information such as flood risk, habitat loss, and burned structures. This information proved essential for developing the course for post disaster efforts."
Press Release -- ESRI Recognizes San Diego County Officials for GIS Work during Wildfires
Sunday, November 11, 2007
San Diego October 2007 Fires
Well, the four year anniversary of the Cedar and Paradise fires was too much of the same. At least as far as the fires go. What was quite different today from four years ago is the response (including the GIS response in some major ways).
We were evacuated and came inches from loosing our home, so I wasn't as involved with the GIS response this time as I was in 2003. But that turned out to be OK since people looked at what didn't go so smoothly in 2003, learned from it, and put policies and procedures in place in case something like the Cedar fire ever happened again. No one thought it would be a mere four years later that so much of the county would be on fire. But they were ready, and things went pretty darn smoothly. Not easy - it never is, but night and day when compared with the Cedar fire response.
It was a treat to see real maps on the news reports. In 2003 we saw so many county wide simplistic maps showing a big campfire image to represent where the fires were. That told the public next to nothing. Fast forward to 2007 where they were showing highly detailed maps of the latest fire perimeters and evacuation areas. How? The County EOC was staffed 24 hours a day with at least three GIS staff making maps - and a number of these were converted to PDF files and provided to the media and the public. So the news stations were showing PDF maps (exported from ArcMap) and interacting with them on large monitors.
Here are a few samples - The Final Evacuation Areas map and the Final Fire Perimeter map.
Subscribe to:
Posts (Atom)

 Posts
Posts

