A collection of various GIS related links, information and other GIS blogs.

Wednesday, August 27, 2008

WOW Technologies and down-right cool stuff on the floor at the 2008 ESRI UC

[ Quite an extensive blog posting on a number of the vendors and their displays at ESRI UC 2009. Be sure to go look at the posting as there are numerous photos and even videos to view along with all the descriptions. From GIS User.com ]

Written by Glenn Letham

Tuesday, 26 August 2008
On the floor at the ESRI user conference. It’s always a flurry of activity and it’s always one of my favorite things to do at the UC… browse the exhibition hall floor and see all the great new apps and gadgets, while getting the low-down straight from the ESRI partners and solution providers. Read on for details of just a few of the great things we found on the floor at the 2008 International ESRI User Conference.

The gang from Avenza had announced some new features planned for the next release of MAPublisher so I had to stop by and see for myself. Turns out the news was big… very big for MAPublisher users and pretty much anyone that’s interested in creating high-quality cartographic output and then export the output to the web via intelligent, data-rich Flash SWF files. The MAPublisher 8.0 export to Flash capabilities will enable users to export complete Adobe illustrator map documents to Flash without any additional coding or software needed… NICE! The app also enables embedding of attributes, creation of rollover effects and pop-ups, embed images, weblinks, and other custom information. Look for MAPublisher 8 in the not too distant fall season. Oh,and to give you an idea what you can accomplish with MAPublisher… Avenza customer National Geographic used the application to produce it’s award winning Atlas of China (http://shop.nationalgeographic.com/product/202/2981/114.html)  – see www.avenza.com

One thing I always do at most shows is to stop and watch a large-format plotter grind away and check out the output… after all, I used to babysit a plotter for hours on end when I was in College so I find it amazing to watch how the technology progresses (I’m sure nobody misses the old pen plotters!)  I wrote a month ago about Oce and their sweet new ColorWave 600 plotter and incredible new inkless technology, well, unfortunately Oce didn’t have a unit with them (that’s how much in demand they are, even they can’t get one) but no worries, the team was touting the popular TCS300 and TCS500 plotters – these are true CAD/GIS plotting workhorses, fast, efficient, and produce amazing output. The company was even passing out $1500 discount vouchers – you can get one by visiting www.esri.com/oceoffers and be sure to tell em Glenn sent you ;0) If you happen to be from a shop that does relatively large volumes of output (say 10,000 square ft+ per month then you might want to check into the ColorWave 600, an affordable solution ($2500 mo. Lease option) that can handle 6 rolls of media, keep cranking for days solid, and generate high-quality, high-res output in a “green” environment (see article) - see also www.oce.com

I bumped into a colleague form New Jersey on the floor and he shared details of the NSDmaps data product with me. Developed by datamapi, the data provides the latest housing developments and n ew construction along with a number of attributes including: builder info, year of development, home age, numbers, development address, and more. These data are provided as SHP files along with the newly created street segments, cul de sacs, street center lines, and address ranges. See nsdmaps.com

Chuck and Matthew from TDC Group were on hand showing off the latest in Freeance - simply put, this solution enables ArcGIS users to extend the Geodatabgse to the field using Blackberry devices (like the new Blackberry Bold). Given Blackberry's penetration into the entrprise space this is a natural fit! Using Freeance, enterprises can now use data from their enterprise GIS and back office databases in mobile applications on BlackBerry smartphones. Mobile workers in government, utilities and business can now easily update their databases for uses...

... follow the link below to read the entire post!...

WOW Technologies and down-right cool stuff on the floor at the 2008 ESRI UC

Tuesday, August 26, 2008

ArcGIS Mobile Blog : New Community Center for ArcGIS Mobile!


New Community Center for ArcGIS Mobile!

The ArcGIS Mobile Resource Center introduced a new Community Center today!

The goal of the Community Center is to grow a vibrant online community centered around Mobile GIS. The community center aggregates all sources of information that change frequently so you have the most recent information. It includes this blog site, forums, knowledge base articles, and a code gallery for developers.

With the launch of the community center, the mobile dev team has uploaded a number of code samples that you can download in the code gallery. All samples uploaded by the dev team are clearly indicated by the "ArcGIS Mobile Development Team" tag on the sample.

During our presentations at UC2008 (both in the technical workshops and at the Mobile Island Demo Theatre), we wrote a lot of code and those of you who attended our presentations have asked for us to share it with you. So the code samples prefixed with "ArcGIS Mobile - " are exactly those samples. Once you have taken a look, please come back to the code gallery and give these samples a rating!

To post your code to the code gallery, all you need to do is log into the code gallery using your ESRI Global account. If you do not yet have one, you can sign up for one here.

...Follow the link below to view the full posting...

ArcGIS Mobile Blog : New Community Center for ArcGIS Mobile!

Sunday, August 24, 2008

Mapping Center : "Angeles River, Los"

[ From the ESRI Mapping Center ]

"Angeles River, Los"

Making maps with data that were never intended for mapping has it's challenges. One of them is trying to use the names from GNIS (Geographic Names Information System) (U.S. Board on Geographic Names).  Even when someone has gone to the effort of assigning these names to GIS features, the way the names are formatted can create problems.  In the case of the GNIS, the names were formatted for an old-style (i.e., pre-modern search engine) alphabetical index that you could visually scan like a gazetteer in an atlas.  The result is that there are entries like "Great Salt Lake, The" or "Grande, Rio" which need reformatting in order to look correct on a map. 

As a general rule if a name in the GNIS, or data compiled with GNIS names, has a comma, then it needs to be edited.  Rather than manually edit each of those names, I felt it would be handy to have something to automate that work. So I wrote a field calculator statement that you can download to do the job.  It gets the portion of the name after the comma and moves it to the front of the string, and removes the comma.

Be careful, first select by attribute all the features that have a comma in the name; minimally it will save time:

"GNIS_Name" LIKE '%,%'    (this is using the correct syntax for file geodatabase format)

Once the features are selected, verify that you have no unexpected commas.  Then while that selection is still applied, calculate the field by loading the FlipAroundComma.cal file that is inside the ZIP file in the hyperlink above.

The result will help your maps look more professional. 

Mapping Center : "Angeles River, Los"

Friday, August 22, 2008

ArcGIS Mobile Blog : Reflecting on UC 2008

[ I get this question a lot - which technology do I need, ArcPad or ArcGIS Mobile?  This post from the ArcGIS Mobile blog discusses this very topic! ]

Reflecting on UC 2008

The users conference has come and gone and we are very thankful to all that came to our technical sessions, demo theatre presentations, and engaged us in conversation at the Mobile Island. This year was a big success for ArcGIS Mobile and we are now back into Redlands busy planning our next release. We received a lot of wonderful feedback from you and are integrating that feedback into our planning and future development as I write this.

We will begin a series of posts on this blog site that provide detailed answers to the most frequently asked questions we received at the island and in our sessions. Here is a sample:

What is the difference between ArcPad and ArcGIS Mobile? How do I choose between the two of them?

ArcPad and ArcGIS Mobile are separate technologies designed for mobile GIS. When deciding which is the appropriate solution to deploy, you need to consider what your field GIS project needs are, the number of field workers you need to deploy Mobile GIS to, and how Mobile GIS fits into your existing IT infrastructure. Follow the link below for the rest of the post...

ArcGIS Mobile Blog : Reflecting on UC 2008

Wednesday, August 20, 2008

Are You ESRI Certified??

Some jobs out there are just impossible to get. I ran across a job opening in out in Reno NV today, and it states in the job announcement "Applicants must be ESRI certified and fully capable in the use and application of ArcGIS software...".

Why do I say that is impossible? Because at this time you can't become "ESRI Certified". There is no ESRI certification program in place at this time.

That just struck me as a bit funny - I know - get a life...

Friday, August 15, 2008

ESRI UC Blog : Governor O’Malley Fights Back with GIS


Governor O’Malley Fights Back with GIS

One of the biggest fans of GIS on the East Coast is undoubtedly Martin O'Malley.

As mayor of Baltimore and now the governor of Maryland, he spearheaded the use of geospatial technology to help measure government performance whether in fighting crime, filling potholes, or reducing water pollution. 

O'Malley told the story of the powerful nature of GIS from his perspective when he spoke Sunday at the 2008 ESRI Senior Executive Seminar in San Diego. Top-level executives from around the world attended the seminar, which preceded the start of the ESRI UC. The executives gathered to learn how GIS is being successfully implemented at major corporations, in government, and non-governmental organizations.

O'Malley said when he took the reins as mayor of Baltimore in 1999, he inherited some serious challenges: a high crime rate, a plummeting population, and therefore a loss of tax revenue to tackle the problems.

"This left us a legacy of underperforming schools, underperforming and unresponsive city services, littered streets and alleys-thousands of vacant buildings and vacant hearts," he said.

To revive the city...read the rest of the story - follow the link below...

ESRI UC Blog : Governor O’Malley Fights Back with GIS

ESRI UC Blog : The 4-H Technology Team at UC

[ Over the last few years a 4-H group has been coming to San Diego a few days early for UC to do real-world projects around the county. Last year they visited with the San Diego Wild Animal Park and did some GPS'ing. This year they worked with the San Diego County Animal Services Department. Good stuff! ]

The 4-H Technology Team at UC

In the early morning of Friday August 1st 2008, twenty 4-H'ers and their adult leaders from eleven states boarded the San Diego trolley.   A couple dozen people—all wearing blue shirts—boarding the trolley at the same time drew a lot of attention.   People wonder who they are and what they're doing.  The answer: the national 4-H Technology Team, in town for the international ESRI User Conference.  They were headed for the San Diego County Animal Services office.

After that morning trolley ride, the team met with a couple of the staff at the animal control facility—both to learn and to teach.  Laura Warde, an Animal Service officer, talked to the team about the San Diego Animal Service's role in emergency animal evacuation.  In the event of a disaster the Animal Services and Humane Society officers go into evacuated areas and provide food and water for abandoned animals.  If necessary, they evacuate the animals as well.

GIS plays a big part in their emergency evacuation work.  Ward said the San Diego Animal Service isn't very "tech savvy," but would like to be.  The 4-H Tech team helped them with that a little.  In the time available, the team took data about locations of issued kennel licenses and Geo-Coded the addresses.  With the Geo-Coded data, they will be able to create maps for the Animal Service.

The group also heard from Captain Denise Gove from the San Diego Humane Society and from the Glynn County Pirates 4-H club, a part of the 4-H Tech Team from Georgia who has done a lot to prepare their county for future emergencies.  They've made emergency evacuation kits, maps showing shelters, and information packets for county residents.

ESRI UC Blog : The 4-H Technology Team at UC

ESRI UC Blog : GIS in Action Video Contest Winners Announced


GIS in Action Video Contest Winners Announced

Congratulations to the very first GIS in Action Video Contest winners: Garrett and Robbi McKinney, creators of "Due South"; and Mike Morrison, James Mallory, and Larry Stein for their video, "Tracing the Trails." The two winning teams produced entertaining videos that creatively demonstrated the use of GIS in very different ways.

So difficult was the decision in selecting a winner, that a tie vote between the ESRI judges yielded awarding two first place prizes which included a Magnabrite magnifying glass page viewer, ESRI Map Book, ESRI 2Gb flash drive, ESRI cap, and an ESRI mini mouse.

In "Due South," the talented McKinney husband and wife team combined...read the rest of the story - follow the link below...

ESRI UC Blog : GIS in Action Video Contest Winners Announced

Mapping Center : How to scatter stacked or clustered marker symbols for point features


How to scatter stacked or clustered marker symbols for point features

Point Disperse OptionsOne of the most frequently recurring topics on Mapping Center is what to do with stacks or clusters of point features on maps. In August 2007, I wrote a blog posting on how to use Maplex to display coincident points, and this worked for some scenarios, but not all.

New with 9.3 is a tool called Disperse Markers; it's in the Cartography toolbox, in the Symbolization Refinement toolset.  The only caveat to using this tool is that your data need to be stored in a geodatabase because the tool works on representation symbology. This will be easier for many map makers, and it will work for more scenarios than the Maplex solution did.

Here is the basic procedure:

  1. Symbolize your point features.
  2. Convert the symbology to representations.
  3. Run the Disperse Markers tool with your point representation layer as the input.

Here is an example of my results...follow the link below for the full post and more information...

Mapping Center : How to scatter stacked or clustered marker symbols for point features

Thursday, August 14, 2008

The AnyGeo Blog - Anything Geospatial: Implementing GIS on the web and ArcGIS smashups

[ From The AnyGeo Blog ]

Implementing GIS on the web and ArcGIS smashups

From last week's International ESRI User Conference - A recap of Implementing GIS on the web - In a presentation titled “Implementing GIS on the web”, Clint Brown provided a Tuesday AM wake-up discussion on what’s happening in the web world and what opportunities are being created. Brown reminded us that at Web 2.0, our second generation web tools and organized access to information has proliferated. The term mashups, is relatively new to the web world but old news to the us in the GIS space… we’ve been mashing up data forever! Keep in mind though, the web is the platform to build a mashup world. I enjoyed Clint's reference to GIS mashups as "Smashups".

Interesting [and accurately in my opinion], Brown conveyed how to the web community, and the bloggers, it’s not GIS but rather, it’s web mapping with the citizens as censors providing the content – citizen censors - and in the future everyone will contribute their own content and search will organize it. BUT, users require an authoritative information framework. A framework to:
Understand and exploit observations
Analyze observations.
Visualize what it means
Give observations meaning.

Addressing the geo tech professionals, Brown pointed out......follow link below for the rest of the post and some related links...

The AnyGeo Blog - Anything Geospatial: Implementing GIS on the web and ArcGIS smashups

Google Geo Developers Blog: Using Google Maps to Visualize ArcGIS Data & Services

[From the Google Geo Developers Blog]

Using Google Maps to Visualize ArcGIS Data & Services

Tuesday, August 12, 2008

Posted by Sterling Quinn, ESRI Developer

Hi, I’m Sterling Quinn and I work on the development team for server-based GIS technologies at ESRI in Redlands, California. We’re happy to report that ESRI software users can now expose their GIS in Google Maps through the recently-released ArcGIS JavaScript Extension for the Google Maps API. The extension is built on the Google Maps API and is designed to communicate with ArcGIS Server, ESRI’s product for serving GIS functionality on the Web.

The ArcGIS JavaScript Extension for the Google Maps API allows you to maintain the user-friendly front end of Google Maps while tapping into an advanced GIS on the back end. You can use the extension to display your own maps on top of Google’s, query features in your database and display them on the map, or expose tasks that run GIS analysis models on the server. You can display your results using the Google Maps API’s native graphics engine and info windows.

To learn how to use the ArcGIS JavaScript Extension for the Google Maps API, use the online SDK, which contains basic concepts, an API reference, and examples of how to create custom maps and Mapplets. The examples contain detailed descriptions on how to do things like adding an ArcGIS Server map type button, displaying query results as KML, or running a task on the server to return a route and elevation profile.

Following are some quick links to example Mapplets...follow the link below to the full story and links...

Google Geo Developers Blog: Using Google Maps to Visualize ArcGIS Data & Services

Sunday, August 10, 2008

Web site helps police,neighbors stay informed | The San Diego Union-Tribune

[ What's missing from this site? A few things. A map might be nice to show where things are happening, but what would really be useful in my mind is the result of map analysis - which is what I thought this was going to be when I saw the headline - like the City of San Diego has (and which has a very similar name - Neighborhood eWatch - but has been available for years). For more info on the San Diego version go here: http://apps.sandiego.gov/ewatch/index.jsp ) What the San Diego version does is take any address within the city that you provide, geocode it, buffer the result and overlay that on the types of crimes you select - and emails you a report each day so you can see how nice or rotten the neighborhood is.

I do have to say that, after reading a few of the blog postings, it looks like some El Cajon Police Officers are regulars on the blog and are returning posts and doing something about what the citizens are posting about - so that is fantastic! ]

Web site helps police,neighbors stay informed

August 9, 2008

EL CAJON: Neighborhood Watch is going digital in El Cajon, where police have launched an interactive Web page to encourage residents to blog and share community concerns with each other and police.

The Web page, elcajonneighbors.org, debuted in May and has already sparked conversation among residents and proved a resource for police officers, some of whom check the site regularly for tips.

“It's another tool for us to use to interact with the community,” said El Cajon police Officer Dan Hansen, a crime prevention specialist who came up with the idea for the site.

At El Cajon Neighbors, people can sign up for e-mail alerts, find out who their school resource officers are and learn about Neighborhood Watch and other crime-fighting programs. The centerpiece is the Neighborhood Blog, where people can post information about community nuisances and potential crimes, such as problems with homeless encampments, speeding on residential streets and barking dogs.

“There is a lot of information out there, a lot of information exchanged (on the Internet) and really, we should be capitalizing on that,” said El Cajon police Lt. Jeff Davis.

The department has even started its own internal blog where patrol officers can communicate with each other about issues on their beats. Officers who work the day shift, for example, rarely see the officers on the night shift.

“It's easier than leaving written notes,” Davis said, “and it's in real time.”

The Web site is part of a larger initiative to reach out to residents and business owners, some of whom might be reluctant to call police about problems that don't rise to the level of a dangerous crime.

“As long as they're not demeaning or insulting to anybody, they can blog about anything in the neighborhood,” Hansen said. “The thing that surprises me the most is how many people have taken to it.”

El Cajon Neighbors has logged more than 28,000 hits since its inception, said Hansen, who plans to add short crime prevention videos to the site. He is trying to spread the word about the site through residents who are working with police to re-energize Neighborhood Watch.

Web site helps police,neighbors stay informed | The San Diego Union-Tribune

Thursday, July 10, 2008

GIS-In-Action Submissions--ESRI User Conference

Show off what you do and win! How do you put "Geography in Action"?

GIS in Action Video Contest

click to enlarge
Prize winners will be announced by August 7, 2008.

Are you a current ESRI customer using a GIS in your daily work or personal life? If so, show us what you do with your GIS, how you do it, and enter to a win prize package of up to $125.

Geography in Action is the theme for this year’s conference. And since the ESRI UC is all about users, we’re sponsoring a video contest to see how you’re using GIS.

Entering is easy. Create an amateur video demonstrating GIS in action and upload it to your favorite video sharing site such as YouTube. Then submit your video entry to us by completing a submission form on or before July 25, 2008. All videos must be tagged with "GIS in Action Video Contest."

A panel of ESRI employees will review all submissions and select a first, second, and third place winner. The winners will be announced by
August 7, 2008.

Watch this Video on YouTube

Prize Packages

  • 1st Place ($125 value): Magnabrite magnifying glass page viewer,
    Designed Maps, 2Gb ESRI logo flash drive, ESRI baseball cap,
    ESRI mini optical mouse
  • 2nd Place ($85 value): Designed Maps, 2Gb ESRI logo flash drive,
    ESRI baseball cap, ESRI mini optical mouse
  • 3rd Place ($45 value): 2Gb ESRI logo flash drive, ESRI baseball cap,
    ESRI mini optical mouse

GIS-In-Action Submissions--ESRI User Conference

Wednesday, June 04, 2008

City of Dover, Delaware, Deploys Groundbreaking GIS Application for NASCAR Events

ArcWatch, May 2008

ArcGIS Server and ArcGIS Mobile Help Officials Monitor Events and Respond Faster to Emergencies

City of Dover, Delaware, Deploys Groundbreaking GIS Application for NASCAR Events

By Jesse Theodore, ESRI Writer

click to enlarge
NASCAR fans gather for the races at the Dover International Speedway in Dover, Delaware. Photograph by Reinhold Matay.

The weekend of May 30–June 1, more than 140,000 fans will line "The Monster Mile" in Dover, Delaware, to whistle and cheer as they urge on their favorite drivers during three days of NASCAR races.

But while others focus on cars traveling at speeds up to 150 miles per hour around the track at Dover International Speedway, public safety officials will be busy watching for problems and ensuring a safe, secure event. And as medical emergencies, disturbances, and code violations are reported, officials will rely on geographic information system (GIS) technology to help them respond to, manage, and coordinate activities faster than ever before.

Managing a City of Race Fans

One of the toughest tasks for local government agencies is managing large-scale events. The City of Dover (population 35,000) has a particularly unusual public safety issue. Twice a year, the city hosts major NASCAR races. The city's population swells to more than 200,000 as fans from all over the United States descend on Dover.

This creates an enormous challenge as local government officials work to protect the many temporary residents visiting the area. Staff and resources come from the fire, health, emergency medical services, law enforcement, public works, and utilities departments and agencies.

click to enlarge
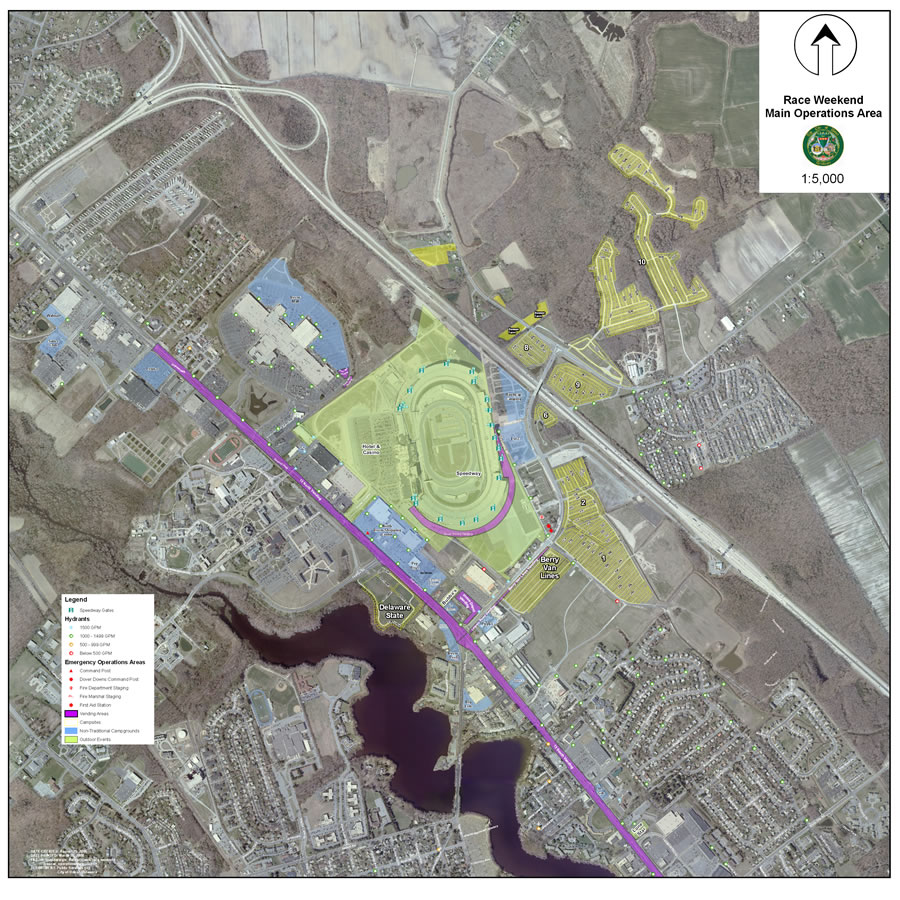
A map of the overall operational area with a 2007 aerial photograph.

To help coordinate every aspect of this vast operation, the City of Dover recently deployed an advanced enterprise GIS platform that gives venue managers the ability to access data and visualize what's happening where at Dover International Speedway. GIS also lets them capture, integrate, and analyze important public safety data, which helps them respond faster and more efficiently to emergencies or other problems. The enterprise solution was successfully used during the NASCAR races that the speedway hosted in June and September 2007.

GIS technology allows event managers, stationed in the Kent County, Delaware, mobile command center next door to the speedway, to view digital map displays of the entire race venue including the track. On the digital maps, the managers receive information concerning incidents and crowd activity.

Using ArcGIS Server and ArcGIS Mobile software from ESRI, staff operating in the command center and in the field can visualize where disturbances, code violations, accidents, and other incidents occur.

Read the full article:  ESRI ArcWatch May 2008 - City of Dover, Delaware, Deploys Groundbreaking GIS Application for NASCAR Events

Mapping Center : Symbolizing a tree canopy

Symbolizing a tree canopy

Not too long ago we received a question on Ask a Cartographer about symbolizing polygons with a scalloped edge (like the old ArcInfo hardwire line symbol). Hoping to do better (scallop lines were a nice idea, but they didn't always turn out as good as I would have liked, so I rarely used them), I started experimenting with the options in representation symbology. I'm happy to report that there is a better solution.

I had some vegetation polygons from a project my team had worked on a few years ago so I copied those polygons into a new file geodatabase, added them to my map, and immediately converted their symbology to representations with out changing the  original randomly applied symbols.  By the way, I'm finding that I use those steps more often now that I'm becoming more familiar with the representation symbology user interface, rather than trying to symbolize my data using the old symbols, and then fine-tuning the resulting representation symbols.

Read the full article: Mapping Center : Symbolizing a tree canopy

Tuesday, June 03, 2008

Vista? 64-bit? Remote Desktop? ESRI License Manager a pain? Help is on the way.

If you use ArcGIS Desktop Concurrent Use and you are a Vista user, or running a 64-bit environment, or have users trying to use Remote Desktop - you might really be looking forward to ArcGIS 9.3 when we upgrade the License Manager software.

The upgrade will be to Macrovision's FLEXnet Publisher v11.4.

OK, so that's good news.


What is even better news? You can get it today!

You can download this upgrade today and use it with your 9.2 environment. I have it running on my laptop.

Here's the direct link to the Support Center:
http://support.esri.com/index.cfm?fa=downloads.patchesServicePacks.viewPatch&PID=43&MetaID=1394

Monday, June 02, 2008

Google spotlights data center inner workings | Tech news blog - CNET News.com

Original post - May 30, 2008

Google spotlights data center inner workings

Posted by Stephen Shankland

SAN FRANCISCO--The inner workings of Google just became a little less secret.

The search colossus has shed only occasional light on its data center operations, but on Wednesday, Google fellow Jeff Dean turned a spotlight on some parts of the operation. Speaking to an overflowing crowd at the Google I/O conference here on Wednesday, Dean managed simultaneously to demystify Google a little while also showing just how exotic the company's infrastructure really is.

Google fellow Jeff Dean

Google fellow Jeff Dean
(Credit: Stephen Shankland/CNET News.com)

On the one hand, Google uses more-or-less ordinary servers. Processors, hard drives, memory--you know the drill.

On the other hand, Dean seemingly thinks clusters of 1,800 servers are pretty routine, if not exactly ho-hum. And the software company runs on top of that hardware, enabling a sub-half-second response to an ordinary Google search query that involves 700 to 1,000 servers, is another matter altogether.

Google doesn't reveal exactly how many servers it has, but I'd estimate it's easily in the hundreds of thousands. It puts 40 servers in each rack, Dean said, and by one reckoning, Google has 36 data centers across the globe. With 150 racks per data center, that would mean Google has more than 200,000 servers, and I'd guess it's far beyond that and growing every day.

Regardless of the true numbers, it's fascinating what Google has accomplished, in part by largely ignoring much of the conventional computing industry. Where even massive data centers such as the New York Stock Exchange or airline reservation systems use a lot of mainstream servers and software, Google largely builds its own technology.

I'm sure a number of server companies are sour about it, but Google clearly believes its technological destiny is best left in its own hands. Co-founder Larry Page encourages a "healthy disrespect for the impossible" at Google, according to Marissa Mayer, vice president of search products and user experience, in a speech Thursday.


Read more: Google spotlights data center inner workings | Tech news blog - CNET News.com

Friday, May 30, 2008

ArcGIS Explorer Blog : Timely information via GeoRSS - Sneak peek at Explorer 480


Timely information via GeoRSS - Sneak peek at Explorer 480

Cyclones in Myanmar. Fires in Florida. Earthquakes in China. Timely information is critical for learning about events as they happen, and subsequently how to respond and what to do in their aftermath. One of the ways that timely geographic information is published is via GeoRSS feeds.

In the upcoming Explorer 480 release GeoRSS feeds are one of the supported connections, joining ArcGIS Server, ArcIMS, and WMS.

Here we've connected to the USGS Shake Map feed, and we're showing the popup content for the 7.9 quake that hit China on Monday, May 12.

Read more: ArcGIS Explorer Blog : Timely information via GeoRSS - Sneak peek at Explorer 480

-

I've seen Geo RSS feeds in action and it looks like a nice way to share location information. I think we will be seeing more of this in use as we see more and more mashups popping up all over.

ArcGIS Explorer Blog : Explorer at Where 2.0


ArcGIS Explorer at Where 2.0

Earlier this morning here at Where 2.0 in San Francisco, John Hanke, Director of Google Earth and Maps, and Jack Dangermond, ESRI President, partnered in a presentation which showcased some of the capabilities of ArcGIS Server 9.3. ArcGIS Server was used to publish KML that was viewed in Google Earth. The KML showed the result of a fire model with predicted burn times from the current fire perimeter (red line at right).

While ArcGIS Explorer is tightly coupled with ArcGIS Server, and has been designed specifically to leverage ArcGIS Server capabilities, ESRI's open architecture also provides support for Google Earth, Google Maps, Virtual Earth, and other custom viewers.

In the ESRI booth at the Where 2.0 conference we're using the same KML and ArcGIS Server-based maps in Explorer. Here we've taken things a little further with the use of the topo map service available from the Explorer Resource Center and the swipe tool. We used the swipe behavior option to swipe just the selected layer. You can set this option by choosing Tools > Options, and then clicking Layer Appearance.

Read more: ArcGIS Explorer Blog : Explorer at Where 2.0

Thursday, March 27, 2008

New ESRI Press Book - Designed Maps

Designed Maps
A Sourcebook for GIS Users Click image for a larger image of Designed Maps cover

This sequel to the highly successful Designing Better Maps, offers a graphics-intensive presentation of published maps, providing cartographic examples that GIS users can then adapt for their own needs. Each chapter characterizes a common design decision and includes a demonstration map, which is annotated with specific information needed to reproduce the design, such as text fonts, sizes and styles; line weights, colors, and patterns; marker symbol fonts, sizes, and colors; and fill colors and patterns. Visual hierarchies and the purpose of each map are considered with the audience in mind, drawing a clear connection between intent and design. The book also includes a valuable task index that explains what ArcGIS 9 tools to use for desired cartographic effects. From experienced cartographers to those who make GIS maps only occasionally, all GIS users will find this book to be an indispensable resource.

About the author:

Cynthia A. Brewer is an associate professor in the Department of Geography at The Pennsylvania State University, where she teaches introductory cartography and map design courses and advises graduate students working in cartography. She has worked as a map and atlas design consultant for the U.S. Census Bureau, National Cancer Institute, National Center for Health Statistics, and National Park Service. She is the co-author of Mapping Census 2000: The Geography of U.S. Diversity, and author of Designing Better Maps: A Guide for GIS Users.

ISBN: 978-1-58948-160-2    2008   184 pages   $39.95