A collection of various GIS related links, information and other GIS blogs.

Wednesday, June 04, 2008

City of Dover, Delaware, Deploys Groundbreaking GIS Application for NASCAR Events

ArcWatch, May 2008

ArcGIS Server and ArcGIS Mobile Help Officials Monitor Events and Respond Faster to Emergencies

City of Dover, Delaware, Deploys Groundbreaking GIS Application for NASCAR Events

By Jesse Theodore, ESRI Writer

click to enlarge
NASCAR fans gather for the races at the Dover International Speedway in Dover, Delaware. Photograph by Reinhold Matay.

The weekend of May 30–June 1, more than 140,000 fans will line "The Monster Mile" in Dover, Delaware, to whistle and cheer as they urge on their favorite drivers during three days of NASCAR races.

But while others focus on cars traveling at speeds up to 150 miles per hour around the track at Dover International Speedway, public safety officials will be busy watching for problems and ensuring a safe, secure event. And as medical emergencies, disturbances, and code violations are reported, officials will rely on geographic information system (GIS) technology to help them respond to, manage, and coordinate activities faster than ever before.

Managing a City of Race Fans

One of the toughest tasks for local government agencies is managing large-scale events. The City of Dover (population 35,000) has a particularly unusual public safety issue. Twice a year, the city hosts major NASCAR races. The city's population swells to more than 200,000 as fans from all over the United States descend on Dover.

This creates an enormous challenge as local government officials work to protect the many temporary residents visiting the area. Staff and resources come from the fire, health, emergency medical services, law enforcement, public works, and utilities departments and agencies.

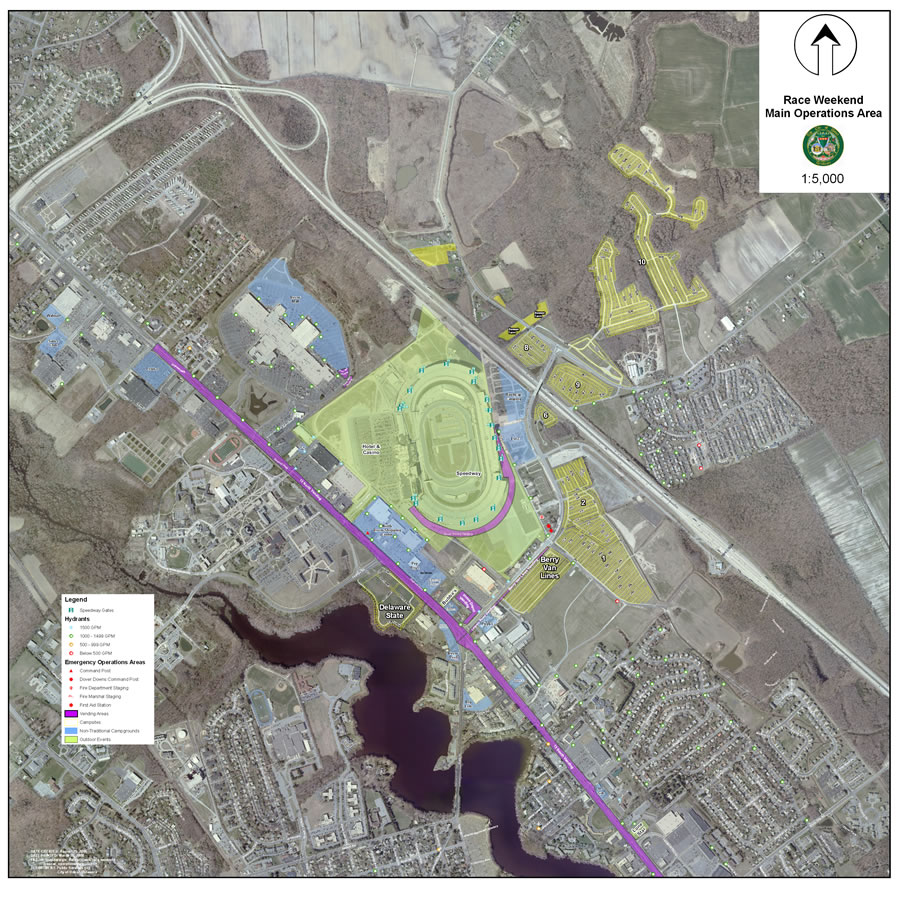
click to enlarge
A map of the overall operational area with a 2007 aerial photograph.

To help coordinate every aspect of this vast operation, the City of Dover recently deployed an advanced enterprise GIS platform that gives venue managers the ability to access data and visualize what's happening where at Dover International Speedway. GIS also lets them capture, integrate, and analyze important public safety data, which helps them respond faster and more efficiently to emergencies or other problems. The enterprise solution was successfully used during the NASCAR races that the speedway hosted in June and September 2007.

GIS technology allows event managers, stationed in the Kent County, Delaware, mobile command center next door to the speedway, to view digital map displays of the entire race venue including the track. On the digital maps, the managers receive information concerning incidents and crowd activity.

Using ArcGIS Server and ArcGIS Mobile software from ESRI, staff operating in the command center and in the field can visualize where disturbances, code violations, accidents, and other incidents occur.

Read the full article:  ESRI ArcWatch May 2008 - City of Dover, Delaware, Deploys Groundbreaking GIS Application for NASCAR Events

Mapping Center : Symbolizing a tree canopy

Symbolizing a tree canopy

Not too long ago we received a question on Ask a Cartographer about symbolizing polygons with a scalloped edge (like the old ArcInfo hardwire line symbol). Hoping to do better (scallop lines were a nice idea, but they didn't always turn out as good as I would have liked, so I rarely used them), I started experimenting with the options in representation symbology. I'm happy to report that there is a better solution.

I had some vegetation polygons from a project my team had worked on a few years ago so I copied those polygons into a new file geodatabase, added them to my map, and immediately converted their symbology to representations with out changing the  original randomly applied symbols.  By the way, I'm finding that I use those steps more often now that I'm becoming more familiar with the representation symbology user interface, rather than trying to symbolize my data using the old symbols, and then fine-tuning the resulting representation symbols.

Read the full article: Mapping Center : Symbolizing a tree canopy

Tuesday, June 03, 2008

Vista? 64-bit? Remote Desktop? ESRI License Manager a pain? Help is on the way.

If you use ArcGIS Desktop Concurrent Use and you are a Vista user, or running a 64-bit environment, or have users trying to use Remote Desktop - you might really be looking forward to ArcGIS 9.3 when we upgrade the License Manager software.

The upgrade will be to Macrovision's FLEXnet Publisher v11.4.

OK, so that's good news.


What is even better news? You can get it today!

You can download this upgrade today and use it with your 9.2 environment. I have it running on my laptop.

Here's the direct link to the Support Center:
http://support.esri.com/index.cfm?fa=downloads.patchesServicePacks.viewPatch&PID=43&MetaID=1394

Monday, June 02, 2008

Google spotlights data center inner workings | Tech news blog - CNET News.com

Original post - May 30, 2008

Google spotlights data center inner workings

Posted by Stephen Shankland

SAN FRANCISCO--The inner workings of Google just became a little less secret.

The search colossus has shed only occasional light on its data center operations, but on Wednesday, Google fellow Jeff Dean turned a spotlight on some parts of the operation. Speaking to an overflowing crowd at the Google I/O conference here on Wednesday, Dean managed simultaneously to demystify Google a little while also showing just how exotic the company's infrastructure really is.

Google fellow Jeff Dean

Google fellow Jeff Dean
(Credit: Stephen Shankland/CNET News.com)

On the one hand, Google uses more-or-less ordinary servers. Processors, hard drives, memory--you know the drill.

On the other hand, Dean seemingly thinks clusters of 1,800 servers are pretty routine, if not exactly ho-hum. And the software company runs on top of that hardware, enabling a sub-half-second response to an ordinary Google search query that involves 700 to 1,000 servers, is another matter altogether.

Google doesn't reveal exactly how many servers it has, but I'd estimate it's easily in the hundreds of thousands. It puts 40 servers in each rack, Dean said, and by one reckoning, Google has 36 data centers across the globe. With 150 racks per data center, that would mean Google has more than 200,000 servers, and I'd guess it's far beyond that and growing every day.

Regardless of the true numbers, it's fascinating what Google has accomplished, in part by largely ignoring much of the conventional computing industry. Where even massive data centers such as the New York Stock Exchange or airline reservation systems use a lot of mainstream servers and software, Google largely builds its own technology.

I'm sure a number of server companies are sour about it, but Google clearly believes its technological destiny is best left in its own hands. Co-founder Larry Page encourages a "healthy disrespect for the impossible" at Google, according to Marissa Mayer, vice president of search products and user experience, in a speech Thursday.


Read more: Google spotlights data center inner workings | Tech news blog - CNET News.com

Friday, May 30, 2008

ArcGIS Explorer Blog : Timely information via GeoRSS - Sneak peek at Explorer 480


Timely information via GeoRSS - Sneak peek at Explorer 480

Cyclones in Myanmar. Fires in Florida. Earthquakes in China. Timely information is critical for learning about events as they happen, and subsequently how to respond and what to do in their aftermath. One of the ways that timely geographic information is published is via GeoRSS feeds.

In the upcoming Explorer 480 release GeoRSS feeds are one of the supported connections, joining ArcGIS Server, ArcIMS, and WMS.

Here we've connected to the USGS Shake Map feed, and we're showing the popup content for the 7.9 quake that hit China on Monday, May 12.

Read more: ArcGIS Explorer Blog : Timely information via GeoRSS - Sneak peek at Explorer 480

-

I've seen Geo RSS feeds in action and it looks like a nice way to share location information. I think we will be seeing more of this in use as we see more and more mashups popping up all over.

ArcGIS Explorer Blog : Explorer at Where 2.0


ArcGIS Explorer at Where 2.0

Earlier this morning here at Where 2.0 in San Francisco, John Hanke, Director of Google Earth and Maps, and Jack Dangermond, ESRI President, partnered in a presentation which showcased some of the capabilities of ArcGIS Server 9.3. ArcGIS Server was used to publish KML that was viewed in Google Earth. The KML showed the result of a fire model with predicted burn times from the current fire perimeter (red line at right).

While ArcGIS Explorer is tightly coupled with ArcGIS Server, and has been designed specifically to leverage ArcGIS Server capabilities, ESRI's open architecture also provides support for Google Earth, Google Maps, Virtual Earth, and other custom viewers.

In the ESRI booth at the Where 2.0 conference we're using the same KML and ArcGIS Server-based maps in Explorer. Here we've taken things a little further with the use of the topo map service available from the Explorer Resource Center and the swipe tool. We used the swipe behavior option to swipe just the selected layer. You can set this option by choosing Tools > Options, and then clicking Layer Appearance.

Read more: ArcGIS Explorer Blog : Explorer at Where 2.0

Thursday, March 27, 2008

New ESRI Press Book - Designed Maps

Designed Maps
A Sourcebook for GIS Users Click image for a larger image of Designed Maps cover

This sequel to the highly successful Designing Better Maps, offers a graphics-intensive presentation of published maps, providing cartographic examples that GIS users can then adapt for their own needs. Each chapter characterizes a common design decision and includes a demonstration map, which is annotated with specific information needed to reproduce the design, such as text fonts, sizes and styles; line weights, colors, and patterns; marker symbol fonts, sizes, and colors; and fill colors and patterns. Visual hierarchies and the purpose of each map are considered with the audience in mind, drawing a clear connection between intent and design. The book also includes a valuable task index that explains what ArcGIS 9 tools to use for desired cartographic effects. From experienced cartographers to those who make GIS maps only occasionally, all GIS users will find this book to be an indispensable resource.

About the author:

Cynthia A. Brewer is an associate professor in the Department of Geography at The Pennsylvania State University, where she teaches introductory cartography and map design courses and advises graduate students working in cartography. She has worked as a map and atlas design consultant for the U.S. Census Bureau, National Cancer Institute, National Center for Health Statistics, and National Park Service. She is the co-author of Mapping Census 2000: The Geography of U.S. Diversity, and author of Designing Better Maps: A Guide for GIS Users.

ISBN: 978-1-58948-160-2    2008   184 pages   $39.95

2008 ArcGIS Server Code Challenge Winners

Congratulations to the winners of the 2008 ArcGIS Server Code Challenge.

The developer community, ESRI Developer Network (EDN) subscribers, and registered attendees for the 2008 Developer Summit voted for the top three samples that best represented creativity, applicability, and originality.


First Place: $15,000

Display Geospatial Analysis results in Google Maps and Microsoft Virtual Earth with ArcGIS Server
John Waterman, Vice President of Geospatial Solutions
East Burke, Vermont, USA

Second Place: $7,500

ArcGIS Server Virtual Tile Server
Dave Bouwman, Senior Software Architect
Fort Collins, Colorado, USA

Third Place: $2,500

SDE Web Catalog
Loganathan Vijay Sambandhan, GIS Developer
Buffalo, New York, USA

Honorable Mention

Google Maps Adapter to ArcGIS Server Map Cache
Nianwei Liu, Senior System Analyst Programmer
Charlotte, North Carolina, USA


More info here

ESRI Careers Blog Now Available

This was new to me, so thought I'd share with you.


ESRI Careers blog. Posts about lectures, new job postings, resume advice, and events like recruiting fairs.

Tuesday, March 25, 2008

Free Pre-Conference Seminar at CalGIS

Heading to Modesto for this year's CalGIS Conference? You might want to think about coming in a bit early to take advantage of a free pre-conference seminar from ESRI. This is modeled after the Desktop Tips & Tricks seminars that folks had to pay for last year.


Be sure to register for this event.


Please note that you must be registered for CalGIS to attend the pre-conference seminar.


From the CalGIS site:

ESRI is pleased to invite you to attend a pre-conference “ArcGIS Desktop Productivity Tips Workshop” presented by ESRI technical staff. This workshop is intended for intermediate skilled users of ArcGIS Desktop who are looking to learn productivity tips and techniques to improve efficiency with ArcGIS Desktop 9.2. The attendees will be provided handouts of the presentation materials in order to follow along with the workshop lecture and demonstrations. This workshop does NOT include hands-on computer workstations. Topics covered in the presentation and demonstrations will include:

  • Tips and tricks for working with Excel files in ArcMap
  • Working with CAD data
  • Managing map documents, layers, and other ArcMap “hidden” settings
  • Time-saving tips for cartography and working with symbols
  • Exporting and printing from ArcMap tips
  • Shortcuts and techniques for modifying feature data with the ArcMap Editor
  • Plenty of time for Questions & Answers!

Click here to register

This workshop will be in Salons I & II of the rooms in the Grand Ballroom, signage will be posted by each door.

April 22, 2008 from 1:00 pm to 4:00 pm and Q & A from 4:00 pm to 5:00 pm.

GIS Education Community Blog : Using Callout Labels in ArcMap

I thought this posting on using callout labels was pretty helpful. Beginner tips really, but weren't we all beginners once!?!


Saturday, March 22, 2008 2:51 AM - tbaker

Using Callout Labels in ArcMap

The ArcMap application within ArcGIS allows you to create an amazing variety of fonts, colors, and types of labels that identify point, line, and area features. One of the most useful types of labels is the callout label. This label “calls out” from the label to an off-site location that is typically not on the feature itself, and sometimes helps make maps that are more clearly understood by students. Consider the following example for a lesson I created about the Philippines. Here, if the labels were placed on the islands, they would obscure the data I wanted the students to explore, which was the human development index by administrative area (province). Therefore, I used callout labels so that they would be offset in the ocean.


How did I create these labels? Under the Layer Properties, under Labels, I selected a “Banner” style label. Under Properties for the banner style, I selected Properties once again, and then bumped up the x offset to 45 and the y offset to 30. You will have to experiment with your own data set for the optimal offset, depending on your map units and the feature shapes that you wish to label. I set the colors for the background and for the text.


I did something else to create the above labels. Many provinces are split up into hundreds of islands. To prevent every single island from receiving a label, I accessed the Placement Properties tool under the Label tab in the Layer Properties.

More on the blog...


READ MORE: GIS Education Community Blog : Using Callout Labels in ArcMap

Thursday, March 20, 2008

Doing a GIS Day event?

November 19th is the date for GIS Day 2008.


This posting on Geography Matters announces that GIS Day focused web sites can be submitted to be included on this collection of GIS Day web sites for the public to access. If you would like some help in creating your GIS Day webs site, take a look at these templates to get you started (download .zip file here)! Get lots of information on GIS Day materials as well.


There is a lot of useful information about setting up and planning for a GIS Day event on the GIS Day web site at http://www.gisday.com.


Hope you have a fun and successful GIS Day event!

Monday, March 17, 2008

Creating a ArcGIS Server legend from Multiple Map Resources

I ran across this posting from Vish about some code he wrote and is sharing that will do some nice things. So if you are programming in .NET for ArcGIS Server and are pulling map resources from a number of places, you may want to check out this code.


From his posting:


The features of the code snippet are:

  • Generates images at the required DPI
  • Customizable legend title
  • Handles group layers
  • Handles symbol groups
  • Creates a legend image of the desired height and width. If the legend entries overflow the height specified, they will be omitted. If all legend entries are required in the images, it should only involve a small change in code to remove the check for overflow.

Here is an example of a legend generated by the snippet.

Sample Legend


READ FULL POST: http://viswaug.wordpress.com/2008/03/16/dynamic-legend-generation-through-the-adf/

Friday, March 14, 2008

Assemblymember Jose Solorio's Bill Threatens Public Access to Government Geodata - Articles

This is a big topic in California - has been for years. Should public agencies be allowed to sell digital data that are created and maintained by staff paid with public funds - or should those data have to be provided at no cost (or just the cost of reproduction) under the Public Records Act. It has been an ongoing debate for many years.

Assemblymember Jose Solorio's Bill Threatens Public Access to Government Geodata

By Bruce Joffe , GIS Consultants
March 04, 2008

On February 14, 2008, California State Assemblymember Jose Solorio introduced a bill, AB1978, to amend Government Code Section 6254.9 of the California Public Records Act (CPRA). As stated in the "Computer Mapping Systems Fact Sheet" issued by his office, the bill seeks to improve the current definition of what constitutes a “computer mapping system.” In fact, the bill distorts the definition of "computer mapping system" further from reality. Moreover, if enacted, this bill would severely weaken the CPRA and reduce the public's access to its governments' records.

The CPRA ensures the public's ability to hold our governmental agencies accountable by guaranteeing access to public records at no more than the direct cost of reproduction. "Public records" include government data and records stored in electronic format. Public records also include computerized maps and associated data, such as those stored in GISs. All government records and data are subject to the CPRA except those types specifically exempted in the CPRA (to protect individual privacy and public safety). Computer software developed by a state or local agency is exempted. "Software" means the programs that instruct computers to manipulate data. Data, the information manipulated by computer software, is not software and is not exempt from the CPRA.

Assemblymember Solorio proposed a new paragraph to add to the CPRA which would exempt "assembled model data, metadata, and listings of metadata" from public records access by the public. I am not sure what meaning he intended by these terms, but my 30 years of experience working as a geographic information consultant to many cities, counties, and state agencies offers the following definitions:


READ THE FULL ARTICLE: Assemblymember Jose Solorio's Bill Threatens Public Access to Government Geodata - Articles

REVIEW SUPPORTING DOCUMENTS:  Background Documents

Thursday, March 13, 2008

Wine and Location Mapping

Corked a bottle of wine the other evening. We end up with a wide variety of wines because my wife likes to buy based on how fun or interesting the labels are. Hey, what do I care - I end up with a lot of bottles to enjoy!

So, pulled out this cork - a man-made cork - and showed it to my wife because there was a graphic of El Capitan on it. She grew up backpacking in Yosemite so I thought she'd get a kick out of it.

Wasn't I surprised when she handed it back to me and said I should look at it again.

Under the Half Dome graphics it says "Adventure Tool #12"
Then "GPS Hike" and the coordinates for the base of El Capitan.

Here are the directions:

  1. 37* 43' 30" Latitude
  2. 115* 38' 00" Longitude
  3. Look up at El Capitan

That's kind of fun. I wonder what the other 11 are and if they are all GPS related.

This wine is from Red Wood Creek - www.redwoodcreek.com

Ahh - the website answers my question from above. Some of the corks are GPS (probably a lot of them), one is a fishing bobber, etc... More here: http://www.redwoodcreek.com/consumer.html

Mapping Center : What to do when your label doesn't draw

Some good tips here on what to do if you are getting unexpected results with your labels. That never happens to you, right?


What to do when your label doesn't draw

So, you have just spent a few minutes deep in concentration setting up your labeling rules and applied them.  ArcMap's little globe is spinning, spinning... spinning... and nothing.  Several of your labels didn't draw. Panic and go to MappingCenter. Right?

Not exactly. 

There are a few things we always do when diagnosing the "where's my label" scenarios, no matter what's being labeled or what labeling engine is being used.


READ MORE: Mapping Center : What to do when your label doesn't draw

Wiley::Geo-Business: GIS in the Digital Organization

Here's a new book focused on GIS in Business. Looks interesting.

Geo-Business: GIS in the Digital Organization

James B. Pick

ISBN: 978-0-471-72998-3
Hardcover
416 pages
January 2008

Exploit the advantages of Geographic Information Systems in your business

Once the domain of cartographers and other specialists, Geographic Information Systems (GIS) are increasingly being employed by the business community. Location-based services, supply chain management, management of field-distributed equipment, geographical marketing and promotion, and the spatial web are some of the current business applications which make use of GIS principles.


LEARN MORE: Wiley::Geo-Business: GIS in the Digital Organization

Question About What’s Coming in ArcGIS 9.3?

More info is coming out about the 9.3 release (see post below) - but I am sure folks still have a number of questions.  ESRI has posted a form for you to do just that - ask questions about what is coming in 9.3. To take advantage of this opportunity, follow the link below.


Question About What’s Coming in ArcGIS 9.3

Ask a question about what’s coming in ArcGIS 9.3 in the questions field provided below, and click "Submit Question" at the bottom of the page.

QUESTION FORM: Question About What’s Coming in ArcGIS 9.3

What's Coming in ArcGIS 9.3

Interested in ArcGIS 9.3? Of course you are. Take a peek at this site to see some of what has been worked on for this next release. 

What's Coming in ArcGIS 9.3

ArcGIS 9.3 continues to expand the use of GIS throughout the enterprise. From GIS professionals to decision makers, clients, and the public, GIS information and analysis can be made available wherever it is needed.

ArcGIS 9.3 is supported on Windows Vista, Windows XP, Windows 2003, and Windows 2000.

ArcGIS 9.3 is expected to be available in the third quarter of 2008.


READ MORE: What's Coming in ArcGIS 9.3

ArcGIS Explorer Blog : Explorer at the FedUC

There are some interesting items in this post on the ArcGIS Explorer blog, so thought I'd link to it here. 

Explorer at the FedUC

Last week [early Feb 2008] marked ESRI's Federal User Conference in Washington, D.C. During the plenary on Tuesday a variety of ESRI software and applications were showcased, including ArcGIS Explorer. We've had a few requests to recap what was shown in a little more detail, so here's the overview of the ArcGIS Explorer plenary presentation.

Read More: ArcGIS Explorer Blog : Explorer at the FedUC