A collection of various GIS related links, information and other GIS blogs.

Wednesday, February 11, 2009

Opening the Landsat Archive

[ I thought some folks out there might find this of interest in case they weren’t notified ]

Electronic access to the entire USGS Landsat 7 archive, enabling users to download standard-format scenes at no charge, has been an amazing success, with over 225,000 scenes downloaded since October 1, 2008.

Previously acquired imagery from Landsat 1 through Landsat 5, is also now available for download at no charge using the same standard processing format. Processing parameters and other details about the products can be found at http://landsat.usgs.gov/products_data_at_no_charge.php

<http://landsat.usgs.gov/products_data_at_no_charge.php> .

Previously offered USGS Landsat products with customer-defined options, including media, are no longer available.

Newly acquired Landsat 7 ETM+ SLC-off and Landsat 5 TM images with less than 40 percent cloud cover are automatically processed and made available for immediate download. Imagery with greater than 40 percent cloud cover can be processed upon request. Once the requested scenes are processed, an email notification is sent to the customer with instructions for downloading. These scenes will then become accessible to all users.

Landsat data can be searched, downloaded, or requested from GloVis or EarthExplorer. High demand for this data may result in slow search performance and processing times, which typically range from 1-3 days for Landsat 7 ETM+ and some Landsat 5 TM data and 3-4 weeks for Landsat

1-5 MSS, Landsat 4 TM and some Landsat 5 TM data. Please contact Customer Service at custserv@usgs.gov with any comments or questions.

Landsat scenes can be requested and downloaded from Glovis (http://glovis.usgs.gov <http://glovis.usgs.gov/> ) or Earth Explorer (http://earthexplorer.usgs.gov <http://earthexplorer.usgs.gov/> ).

Monday, February 09, 2009

ArcGIS Mobile Videos

ArcGIS 9.3: Improve mobility using ArcGIS Mobile

ArcGIS 9.3:  See an example of how an Insurance Claims Manager uses ArcGIS and a mobile solution

ArcGIS 9.3: Disseminate Information To The Field Using ArcGIS Mobile

ArcGIS Mobile Questions and Answers

ArcGIS Mobile Users Conference Demo

Do You Know Your Training ROI?

By Suzanne Boden, Program Coordinator, ESRI Educational Services

Faced with daily media reports of grim economic news, many organizations have cut or eliminated nonessential spending. Often, staff training becomes one of the first casualties. The reasoning may be that training, like a store-bought latte, is considered a luxury that can be done without in lean times.

Undoubtedly, fiscal belt tightening is in order for many of us, at least for the near term, if not the long haul. However, forward-thinking organizations consider relevant training an investment, not a luxury. Similar to a flu shot, training for GIS staff can reduce the likelihood of a high-impact illness (i.e., operational breakdown) down the road, when you least need or expect it. Having a cadre of well-trained staff does not guarantee that nothing will ever go wrong with your GIS program or the business operations that rely on the GIS, but training does instill a measure of confidence that your program is healthy.

Gaining a Return on Instruction

Is it possible to define a training return on investment (ROI)? Or, perhaps we should think in terms of return on instruction. Typical ROI analyses are complex and require many different data from several points in time. Below are some training benefits that, while they have not been measured scientifically for this article, are supported by strong anecdotal evidence based on what our customers tell us. Training will

  • Increase staff efficiency. It is not uncommon to hear students who have learned a single software task in an ESRI instructor-led class excitedly claim they will now save hours on the job.
  • Raise staff productivity. A natural result of increased efficiency, productivity increases when tasks are completed more quickly. More tasks can be completed in less time.
  • Increase staff knowledge. This benefit may seem obvious, but knowledge is more than the sum of the topics covered in a class. Knowledge is the synthesis of different concepts and skills learned over time, which enables a person to recognize and act to prevent errors and reduce liabilities.
  • Lead to new business opportunities. Again, this benefit is a natural extension of the previous benefit. When your employees are well trained, they are free to be creative and see possibilities for information products and workflows that may not have been apparent before the training. Interacting with peers in class by exchanging ideas and experiences certainly helps realize this benefit.

Lee Hartsfield is the Tallahassee-Leon County GIS (TLC GIS) coordinator. Last August, ESRI recognized the work of TLC GIS with the 2008 Special Achievement in GIS Award. Hartsfield sees benefits from hosting ESRI instructor-led courses together with other agencies to jointly train their staff and share costs.

"We have built relationships that are called on time and time again to share knowledge and experience," says Hartsfield.

Invest in People Who Work with GIS

Training is not a cure for an economic crisis, and it will not save a GIS program that has systemic flaws. It can, however, help bolster the bottom line in the long run. Especially in lean times, investing in the people who work with GIS is a good strategy for earning the organizational benefits expected from the GIS.

For Darren Rozenek, GIS administrator for the City of Akron (Ohio) Public Utilities Bureau, ESRI training was invaluable when the city decided to migrate its old shapefile-based system to an enterprise ArcSDE geodatabase.

"With a more effective and streamlined workforce, the city of Akron GIS program is positioned to take full advantage of the GIS technology and fully support the needs of our city and its citizens in the future," Rozenek says.

Read the full article: http://www.esri.com/news/arcwatch/0109/training-roi.html

Thursday, February 05, 2009

ArcGIS Explorer 900 preview

ArcGIS Server / ArcGIS Mobile Code Challenge

ESRI Offers $16,000 in Cash Prizes for the 2009 ArcGIS Server Mashup and ArcGIS Mobile Code Challenges

Redlands, California—ESRI invites developers to share their creativity and expertise with the geographic information system (GIS) developer community by submitting original code samples to the ArcGIS Server Mashup and ArcGIS Mobile Code Challenges at www.esri.com/codechallenge. The first-place prize for the ArcGIS Server Mashup Code Challenge is US$7,000, and the second-place prize is US$3,000. The first-place prize for the ArcGIS Mobile Code Challenge is US$4,000, and the second-place prize is US$2,000.

The ESRI developer community will have an opportunity to review and vote for the top two entries in each challenge based on creativity, applicability, and the relevance of each code sample. Each entry must be a mobile GIS application developed using the ArcGIS Mobile Software Development Kit (SDK) or a Web mashup built with ArcGIS Server SDKs.

Code challenge winners will be announced at the 2009 ESRI Developer Summit, an event for developers who use GIS, mapping, and spatial data. The summit will be held March 23–26, 2009, in Palm Springs, California. Developers will learn the latest GIS technologies and best practices to build, customize, and deploy spatially enabled applications.

These code challenges are open to developers worldwide, including ESRI business partners, provided the applicant or the applicant's organization is a licensed user of ArcGIS Server 9.2, ArcGIS Server 9.3, or a current ESRI Developer Network (EDN) subscriber.

More info: http://www.esri.com/news/releases/09_1qtr/2009_arcgis_code_challenge.html 

Details: http://www.esri.com/codechallenge

Friday, January 30, 2009

“GIS is a Green Technology” – new white paper available

GIS Supports Global Green Initiatives

With the growing unease and awareness among large segments of the population that remedial
action must be taken to resolve the many environmental crises we now face, GIS solutions are
currently being implemented around the world that provide the technological and scientifi c support
necessary to create programs and processes designed to return our planet to a more sustainable
and balanced level of use.

Whether increasing the effi ciency of fl eet vehicles by optimizing standard routes and subsequently
reducing fuel consumption or determining the optimum location for a wind farm to produce energy
with minimal pollution, GIS provides the quantifi ed information and analytical capabilities necessary
to make decisions that can both support growth and reduce consumption.
The visualization capabilities of GIS afford a unique way of examining things that promotes creative
out-of-the-box thinking, providing insight and solutions that are not so apparent in written reports
and tabular data. Often, an existing GIS implementation stimulates the need to modify existing
business practices or apply new ones that lead to savings in both costs and resources.

The stories included in this e-book detail GIS-based applications for innovative, sustainable
solutions to many of today's common environmental problems. Cascade County, Montana, uses
GIS to map the optimum locations for wind farms and promote investment in this "green" energy
source. Buffalo, New York, known as the City of Trees, maintains its urban forest inventory with
GIS. Air pollution in Jakarta, Indonesia, is severe; in 2004, 46 percent of all illness in the city was
respiratory related, but backed by GIS-based scientifi c studies, the government has implemented
an ambitious plan to improve air quality. The release of carbon dioxide (CO2) into the atmosphere
is the fundamental cause of global warming; GIS is being used in the study and implementation of
CO2 sequestration programs, which either capture the pollutant at its source or absorb it through the
planting of vegetation. The U.S. Army Corps of Engineers used GIS to restore the natural habitat
of the Middle Rio Grande in New Mexico, and the City of Boston, Massachusetts, is implementing
an ambitious solar energy program by using GIS to calculate the solar radiation available on city
rooftops.

As ESRI president Jack Dangermond has often said, "The application of GIS is only limited by the
imagination." GIS Is a Green Technology provides an introduction to the powerful capabilities of the
software when applied to environmental and sustainability issues as well as the ingenuity of those
developing these innovative applications.

Get the 50-page PDF here: http://www.esri.com/library/bestpractices/gis-is-green.pdf

GIS for Decision Support and Public Policy Making

Click image for a larger image of GIS for Decision Support and Public Policy Making cover

Elected officials and department heads are increasingly relying on geographic information system (GIS) technology to make efficient and accurate decisions when and where it counts. GIS for Decision Support and Public Policy Making presents twenty-seven case studies and eight exercises that demonstrate the positive impact of incorporating GIS methodology in daily operations of the public sector. Discover how GIS has improved the communication, collaboration, and decision making in the organizations featured in this book. A return on investment (ROI) matrix is also included as a resource to evaluate cost and time savings due to the increased productivity that a GIS allows.

Thursday, January 29, 2009

Funny, Sad and Interesting – all at the same time…

You have got to take a look at this blog posting on GIZMODO – it is…interesting…

Google Maps Car Hits a Deer, Records Entire Ordeal on Google Maps

Maybe not “real time” data – but certainly real!

What's Coming in ArcGIS 9.3.1?

[ ESRI has posted some info about what’s is coming at the 9.3.1 release. For those of you that haven’t heard, 9.3.1 will be released around mid-year 2009. 9.4 is sometime the following year – don’t ask for a more specific date, we don’t have one yet!

Here are the major topic areas – hit the link at the end for more details. ]

High-Performance Dynamic Map Publishing

Better Sharing of Geographic Information

Enhanced Support for Java Developers

Easy to Install

There is also a FAQ.

http://www.esri.com/software/arcgis/whats-new/whats-coming.html

Tuesday, December 09, 2008

FOXNews – Google Earth Accused of Aiding Mumbai Terror Attacks

http://www.foxnews.com/story/0,2933,464246,00.html 

An Indian court has been called to ban Google Earth amid suggestions the online satellite-imaging service was used to help plan the terror attacks that killed more than 170 people in Mumbai last month.

A petition entered at the Mumbai High Court alleges that the Google Earth service "aids terrorists in plotting attacks."

Advocate Amit Karkhanis has urged the court to direct Google to blur images of sensitive areas in the country until the case is decided.

There are indications that the gunmen who stormed Mumbai on Nov. 26, and the people who trained them, were technically skilled.

The group appears to have used complex GPS systems to navigate their way to Mumbai by sea. They communicated by satellite phone, used mobile phones with several different SIM cards and may have monitored events as the siege unfolded via BlackBerry Web browsers.

Police in Mumbai have said the terrorists familiarized themselves with the streets of Mumbai's financial capital using satellite images, according to the sole gunman to be captured alive.

The commandos who stormed the Taj Mahal Palace hotel in Mumbai said the militants had made a beeline for the building's closed-circuit security-camera control room.

The legal petition also follows unconfirmed reports that Faheem Ahmed Ansari, a suspected militant who was arrested in the northern state of Uttar Pradesh in February, said he was shown maps of Indian locations on Google Earth by members of Lashkar-e-Taiba, the Pakistan-based terrorist faction that Indian officials are convinced was behind the Mumbai attacks.

Tuesday, December 02, 2008

Getting to Know ArcGIS Desktop – 9.3

Many of you have probably seen – and hopefully used! – this book over the years. It has been very popular and I hear from many folks that it is very useful to them. So it is nice to see that it is being updated for ArcGIS Desktop 9.3!

----------------

ESRI Press Updates Getting to Know ArcGIS Desktop for the 9.3 Software Release

Redlands, California—ESRI Press has published an update to its best-selling book Getting to Know ArcGIS Desktop: Basics of ArcView, ArcEditor, and ArcInfo, Second Edition, with revisions that will make the exercises compatible with the latest software release, ArcGIS 9.3.

Getting to Know ArcGIS Desktop, an ESRI Press best seller for seven years, has schooled tens of thousands of people in the basics of how to use geographic information system (GIS) software technology.

The workbook introduces GIS concepts and capabilities and describes the features and functionality in ArcView, ArcEditor, and ArcInfo, the core products in the ArcGIS Desktop line. Step-by-step exercises, accompanied by richly detailed illustrations, teach basic GIS tasks such as how to conduct spatial analyses, make maps, and build and edit spatial databases.

Readers will learn to use the software applications that form the building blocks of ArcGIS: ArcMap, used for displaying and querying maps, and ArcCatalog, used for managing geographic data. They also will learn how to create a personal geodatabase; geocode addresses; join or relate tables; and build models using ModelBuilder, a graphical interface for diagramming and processing solutions to complex spatial analysis problems.

Instructions in Getting to Know ArcGIS Desktop have been updated to reflect ArcGIS 9.3 enhancements. To learn more about the latest version of ESRI's software, visit www.esri.com/whatsnew. The workbook includes a 180-day single-use trial version of ArcView 9.3 software on DVD and a CD of data for working through the exercises.

Getting to Know ArcGIS Desktop: Basics of ArcView, ArcEditor, and ArcInfo, Second Edition Updated for ArcGIS 9.3 (ISBN: 9781589482104, 600 pages, $79.95), is available at online retailers worldwide, at www.esri.com/esripress, or by calling 1-800-447-9778. Outside the United States, visit www.esri.com/esripressorders for complete ordering options or contact your local ESRI distributor. For a current distributor list, visit www.esri.com/distributors. Interested retailers can contact ESRI Press book distributor Ingram Publisher Services.

Monday, November 24, 2008

California GIO

Many folks have been pushing for and working towards the establishment of a position for a statewide GIO. I heard a few weeks ago that it was approved, and now the job announcement is out.

If you think you have the skills, knowledge and everything else that will be needed to navigate in Sacramento – please take a look!

http://jobs.spb.ca.gov/bull2/ceaexambulletin2.cfm?bid=11192008_4&view=h 

Nice pay too…

Saturday, November 22, 2008

Microsoft & ESRI team to geo-enhance FusionX

Watch for more on this in 2009.

---------------------

November 20, 2008

Microsoft, ESRI to Help Improve Homeland Security Operations

Technology partnership in FusionX makes fusion center situational analysis affordable, easy to use.

Redmond, Washington, and Redlands, California—Microsoft Corp. and ESRI together are driving Homeland Security innovations to more effectively help protect citizens, prevent and solve crimes, and enable counter-terrorism through software. The newly formed collaboration will combine the best capabilities from both organizations in geospatial and collaborative technologies, and will result in advanced intelligence for state and local data fusion centers and emergency operations centers.

An intended product of this collaboration is the FusionX Appliance, a baseline IT architecture for fusion centers, which will provide users with advanced collaboration and geospatial intelligence capabilities by combining the power of ESRI’s ArcGIS Server Advanced Enterprise with the collaboration capabilities of Microsoft Office SharePoint Server 2007.

FusionX will enable homeland security and law enforcement personnel to analyze previously disparate data sets in a mapping context and easily share that information in near real time with relevant stakeholders. FusionX will enhance the abilities of fusion center directors at the strategic and tactical level, enabling them to visualize patterns and trends to help prevent future acts of terrorism and crime, and facilitate a faster and more informed response when necessary. Through the intake of raw data such as fire, police and citizen reports, FusionX will allow for geocoding and mapping of the data to help detect man-made acts of terrorism and crime, such as organized, gang and drug-related activity. Critical GIS data is made accessible and shareable, replacing current collaborative analysis methods that rely on paper exchange and e-mail.

The IT architectural features of the appliance include the following:

  • Sophisticated management dashboards through the advanced monitoring, modeling, analysis and planning capabilities of ArcGIS Server and Microsoft Office PerformancePoint Server 2007
  • ESRI ArcGIS Server Advanced Enterprise, Microsoft Office SharePoint Server 2007, Microsoft Office PerformancePoint Server 2007, Microsoft SQL Server 2008 and access to terabytes of high-quality pre-rendered base maps and imagery
  • An advanced situational awareness portal with support for GeoRSS feeds, Keyhole Markup Language (KML) feeds and other data that will be integrated in the SharePoint environment for access control features and information sharing
  • Best practices and foundational content specific to anticipated operator and analyst requirements. Customers will be able to customize the software as necessary, but the goal is to deliver capability that is usable after only minimal configuration.

Our police forces, sheriff departments and fusion center managers are increasingly relying on collaboration tools that help them connect the dots in a world of asymmetrical threats," said Gail Thomas-Flynn, general manager of State and Local Government at Microsoft. "Microsoft and ESRI’s FusionX Appliance provides the layman- to expert-level technology that can facilitate the intake, analysis, visualization and dissemination of information to the right person, at the right time, in the right place."

The FusionX Appliance will deliver advanced geospatial and collaboration capability with minimal configuration and maximum ease of use, yet at an affordable price. It will be extensible so as to grow with the needs of an individual customer. The FusionX Appliance also will allow for the scaling of its technology architecture framework to a broader set of federal, state and local domestic security and public safety agencies with capabilities such as geoprocessing and geoanalytics.

"We understand what it takes to provide secure and mission-critical capabilities in ways that leverage the technologies that many customers already own," said Russ Johnson, public safety industry manager at ESRI. "And that is extremely important in this economic climate."

More information about the program is available at http://www.microsoft.com/industry/government/solutions/FusionX/default.aspx.

# # #

About Microsoft
Founded in 1975, Microsoft (Nasdaq "MSFT") is the worldwide leader in software, services and solutions that help people and businesses realize their full potential.

Press Information:
Matt Donovan, Merritt Group
Tel.: (703) 390-1519
E-mail (press only): donovan@merrittgrp.com

Friday, November 21, 2008

What’s Shakin’?

Golden Guardian took place recently in California. It simulated a big quake as an opportunity for agencies to test their emergency preparedness and also to see if/how they could work together. In San Diego Caltrans District 11 was out with mobile units gathering information of “damaged” roadways and bridges that needed repair or inspection. This field collected data was transmitted up to Sacramento and loaded up into ArcGIS Server based webservices along with data from other agencies around the state. San Diego County EOC was one such agency.

Cities and counties were then able to consume these webservices in their own applications, in Common Operating Picture viewers based on the ArcGIS Server flex API, or in ArcGIS Explorer.

When the fires started breaking out in southern California (Freeway, Sayre, and Tea) before the exercise was complete, they re-tasked servers, loaded in real emergency information gathered at the fires and kept on serving it up to end users fighting the fires and making decisions on how to allocate resources.

-------------------------------------

November 17, 2008

GIS Delivers during the Largest Earthquake Drill in U.S. History

ESRI Provides Staff and Resources for the Great Southern California ShakeOut

Images for Publication

A GIS-based common operating picture provides continuous data updates. Understanding hospital occupancy levels helps officials direct emergency medical service crews transporting new patients.

Redlands, California—At 10:00 a.m. on November 13, 2008, millions of people throughout Southern California participated in the Great Southern California ShakeOut Drill, the largest earthquake preparedness exercise in U.S. history. The drill simulated a magnitude 7.8 earthquake along the San Andreas Fault in Southern California. ESRI supported participating agencies with software, staffing, and resources used during the exercise, which modeled assessment, rescue, relief, and recovery efforts. Geographic information system (GIS) technology was used to help build an accurate, continuously updated emergency information repository; aided decision support and resource management; and enhanced multijurisdictional communication.

"We worked diligently to create a realistic exercise that helps us see where we are with our response capability in the event of a major earthquake," says John Ellison, agency technology officer and geographic information officer (GIO)/California Environmental Resources Evaluation System (CERES) director, California Resources Agency. "By upgrading to ArcGIS Server 9.3 and ArcGIS API for Flex, we have an easy-to-use Web-based viewer suitable for this purpose. We are very pleased with our GIS experience including during the exercise."

The ShakeOut kick-started a weeklong collection of exercises called the Golden Guardian 2008, held November 13–18 and involving 5,000 participants from public agencies around the state. Based on scientists' predictions of what would occur during and after a major earthquake, the simulated results included 1,800 dead, 50,000 injured, and $200 billion in damages. The goal of the drill was to test and evaluate processes, equipment, technologies, and shared workflows. Results helped determine best practices, opportunities for improvement, and potential new capabilities.

"The GIS platform developed for the Golden Guardian 2008 exercise proved to be an invaluable tool," says Paul Hardwick, GIS project manager, San Diego Homeland Security Regional Technology Center. "We were able to post pertinent information to provide situational awareness to the state emergency command center and affected communities as well as areas adjacent to the disaster. The ability to transfer information between systems and to implement server-based tasks for analysis helped make the event a success."

Multiple Emergency Operations Centers (EOCs), including California Resources Agency, deployed ESRI's Situational Awareness Bundle for the ShakeOut. The bundle provides a complete framework for geospatial intelligence analysis, visualization, and management. Users managed multiple events with the bundle's ready-to-operate hardware solution, its powerful data fusion and analysis engine, and a set of fully customizable viewers to display the affected areas. Staff also used terabytes of prerendered data including street networks, raster imagery, topographic maps, shaded relief imagery, and elevation data.

GIS helped collect and manage large volumes of diverse data including simulated damaged buildings, roads, and power and water infrastructure; affected populations; delivered supplies; and the deployment of fire, emergency medical services, law enforcement, and homeland security staff. Live data, such as weather updates, video, and Global Positioning System (GPS) information, was streamed into the GIS database and disseminated to individuals using desktop computers, mobile devices, and Web-enabled laptops. Mobile GIS helped field crews collect remotely sensed data that was automatically sent back to the comprehensive spatial database.

The ShakeOut was organized by the Earthquake Country Alliance (ECA), a partnership of earthquake professionals, emergency responders, business leaders, and community activists. The group has been planning the ShakeOut since 2006.

Flex API for ArcGIS Server

The folks I’ve shown sample Flex viewer sites have really liked what they saw. I think these will be a popular item for a lot of users.

-----------------------

October 29, 2008

New ESRI ArcGIS API for Flex Enhances Web Mapping

Web GIS Tool Gives Developers Direct Access to ArcGIS Server 9.3

Redlands, California—Web geographic information system (GIS) technology takes a forward leap with the release of ESRI's ArcGIS API for Flex. With the Flex API, developers can combine GIS-based Web services from ArcGIS Server with other Web content, which can be displayed in simple, dynamic mapping applications over the Web or on the desktop.

The API exploits the powerful geospatial capabilities of ArcGIS services. Users can transform their local data into a visually rich interactive map, query and display GIS data features and attributes, locate addresses, identify features, and perform complex spatial analytics. Integrated with Adobe Flex Builder 3, Flex is a client-side technology that is rendered by Flash Player 9 or Adobe AIR. As long as developers have access to ArcGIS Server via a URL, they can program with ArcGIS API for Flex remotely. Since the API is built on the Adobe Flex framework, developers can put all Flex components, such as list boxes, data grids, landscapes, and text controls, into custom applications.

Developers can download the API library at the ArcGIS API for Flex Resource Center and access the source code for a variety of samples of displaying tiled maps, turning layers off and on, and switching between different kinds of maps and imagery. The samples demonstrate how to incorporate symbology, create a map layer, geocode, analyze data, add drawing tools, and much more.

The resource center contains specific documentation about using the packages and classes included in the library. The resource center also includes a code gallery with sample applications for the developer community to see each other's work and speed learning.

A podcast is available that features Mansour Raad, a senior software architect at ESRI, discussing the new ArcGIS Server API for Flex. It includes topics such as MXML, ActionScript, REST, and Adobe AIR.

An early adopter of ArcGIS API for Flex and ArcGIS Server is the City of Boston, Massachusetts, which recently deployed the Solar Boston application, a public-facing Web mapping application designed to showcase active renewable energy installations. The application with a fast and visually dynamic user interface allows users to calculate the solar power that can potentially be obtained via rooftops.

"We chose ArcGIS API for Flex because it allowed us to leverage the power of ArcGIS Server while delivering a rich, interactive experience to our users," explains Greg Knight, senior GIS applications developer, Boston Redevelopment Authority. "Development was both fast and enjoyable, and we are pleased with the functionality and performance of the application."

To learn more about the ArcGIS API for Flex and ArcGIS Server, visit www.esri.com/flex or call 1-800-447-9778.

Thursday, November 06, 2008

Government Technology: GIS Saves Baltimore County $4 Million Annually

Aug 20, 2008, By Matt Freeman

Baltimore County, Md., operates an enterprise GIS that is available to all county agencies and departments. The county also gives the public access to its GIS maps, data and services through a fee-based program that's designed to provide printed copies of published maps and access to the digital data and services for the creation of custom products based on customer specifications.

While GIS is used extensively by most county departments and is popular with the public, it comes with a hefty price tag. The county's budget for GIS hardware, software, personnel, database maintenance and training has steadily risen since purchasing its first ESRI ArcInfo license back in the mid-1980s. As a result, the Office of Information Technology (OIT) and Office of Budget and Finance initiated a strategic business plan focusing on determining the return on investment and use of Baltimore County's GIS.

The county contracted with Dewberry, a geospatial technology firm, to conduct the study. Rather than examining the historical costs and benefits of the county's GIS technology utilization, the study was accomplished during an eight-month period from September 2006 through May 2007. A thorough analysis of Dewberry's findings were outlined and published in the Baltimore County GIS Strategic Business Plan.

In the plan, Dewberry provides detailed information on existing GIS layers; identifies key users and their uses; establishes current benefits, including cost avoidance, revenue and productivity gains; distinguishes current costs, including software, hardware, support and maintenance; and delivers recommendations on key areas the county could focus on for future GIS use.

By the Numbers
Baltimore County's GIS Benefits

119,377 - Hours saved from using GIS.

$4,052,895 - Money saved from using GIS (total number of hours saved at $33.95 per hour).

$606,626 - Other benefits realized from using GIS (e.g., an agriculture preservation program, savings derived from performing work in-house as opposed to using consultants, and revenue collected from data-request fees).

$4,659,521 - Total annual benefits realized from the use of GIS.

121 percent - Percentage of annual benefits realized from the use of GIS after its cost is subtracted.

221 percent - Percentage of money saved from using GIS.

-- According to the Baltimore County GIS Strategic Business Plan, figures from September 2006 through May 2007

The plan suggests that the county's current enterprise GIS implementation is a viable technology that provides a significant return on investment and important quantitative benefits to its users. However, many business processes were uncovered that could further benefit from additional GIS integration. As a result, the plan sets forth a series of enterprise recommendations that prioritize these findings and proposes a course of action for their implementation. Recommendations and action plans include: hiring a GIS program manager, implementing a GIS-based disease tracker, developing a customized GIS application and automating the retrieval of current data regarding school capacity.

A large portion of the study focuses on GIS as a suitable technology for use by local government on a cost and benefit basis. Costs are broken down into the categories of enterprise, agency and capital. The plan defines costs as any expenditure required to support GIS activities within the county, such as personnel salaries for resources dedicated to database maintenance and administration, hardware and software costs, training and conference costs, capital expenditures, and miscellaneous supply and administrative costs.

Establishing the county's GIS benefits was a more extensive exercise. A team of county staff members worked to define hundreds of activities that utilize GIS for each agency within the county. GIS activities included range from determining the location of sidewalk ramps, to protecting and managing groundwater resources, to maintaining an inventory of all county-owned bridges. By analyzing and comparing the time spent

to perform an activity with and without GIS, Dewberry derived a time-savings benefit. The total hours were then multiplied by a standard rate of $33.95 per hour and used for all personnel savings calculations. Additional benefits included cost avoidance by applying GIS technology, and revenue from the license of GIS products, such as the maps, data and services gained through the public access Web site.

The team also compiled a list of individuals to gather information about the activities, which led to a series of interviews conducted by Dewberry. In the interviews, questions were asked to uncover specific business processes and applications for data uses. In addition to the interviews, questionnaires and follow-up phone calls were used to compile data about the GIS infrastructure, comparable industry practices and public-access programs within the county. The information was used to compile agency-specific reports, which Dewberry presented to each agency.

The impact of the GIS Strategic Business Plan is just beginning to be realized by Baltimore County. GIS personnel have been reassigned to streamline operations, and the OIT is developing GIS service-level agreements to better define the GIS infrastructure, product and services. Another benefit has been the increased communication between agencies on GIS activities and database needs. Overall, the study charts a course forward for GIS use and offers agencies the challenge to further integrate GIS into their business processes.

Matt Freeman is a writer with ESRI and contributed this article to Government Technology

[[ See original article here ]]

Friday, October 31, 2008

SANDAG GIS team – winning awards!

Longtime GIS users, the San Diego Association of Governments (SANDAG) has a lot of experience in doing GIS-based analysis for aiding in decision-making and making a lot of maps.

Recently some of these maps have won some awards (read about it here)!

And here are PDFs of the maps:

2007 San Diego Wildfires: Half a Million People Evacuated (Where did that number come from?)

Downtown San Diego - 2030 Commute Cost Analysis: How much do you really pay to get to work in the morning?

Visit the SANDAG website to learn more about how they use GIS technologies and to download free San Diego area data.

Saturday, October 11, 2008

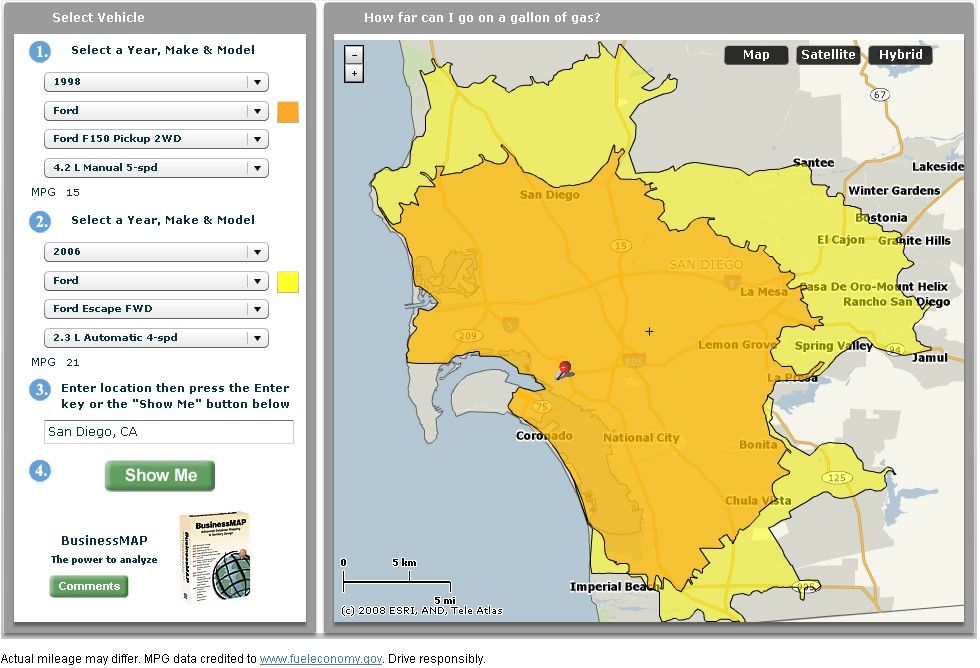
How far can YOU go on a gallon of gas??

Here's a fun way to find out. Take a look at this demo site called MapMPG (beta). This is based on Business Map (with fuel data from http://www.fueleconomy.gov) and takes your input information on the make, model and year of two cars, and a choice of locations - and gives you a map of how far those cars can drive.

Might be a good tool to use when thinking about new cars.

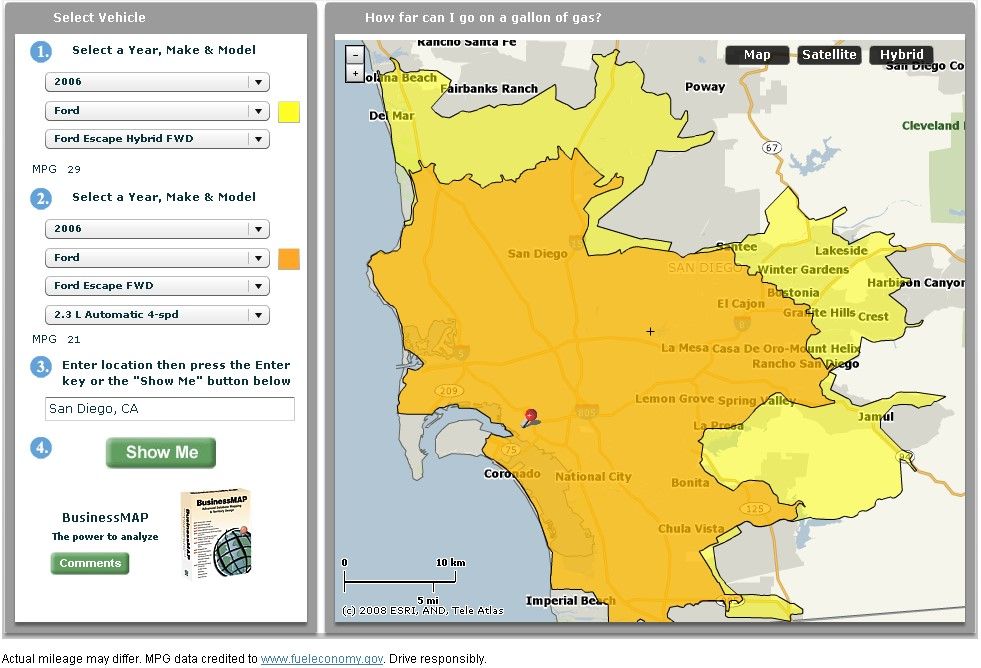
For example - if we had purchased a Hybrid Escape a few years ago instead of the 2WD, I would be getting about 8 MPG more...

This shows our 1998 F-150 and out 2006 Escape (click for full size):


We thought about getting the Hybrid, but just couldn't swallow the extra cost. Of course, gas was a lot cheaper back then too. Here's the distance of the 2WD gas versus the 2WD hybrid (click for full size):


For more information on BusinessMap, go to: http://www.esri.com/software/busmap/index.html

Mapping Center : I remember making this feature class...I wonder why?


I remember making this feature class...I wonder why?

Have you ever wondered where a feature class came from as you've browsed over one of your geodatabases in ArcCatalog? I think most of us have, and probably more often than we'd like to admit. In the example shown here to the left, I made these datasets a few weeks ago, and I have no idea what "GN" means, and if or how I selected, simplified, or dissolved the data.

There are a couple of things we can do to avoid that puzzled feeling: standardize your feature class naming convention; standardize your geoprocessing.  With the naming convention, I started doing the right thing here, but failed to follow through and leave myself the necessary clues. The data in the image above was also the result of a complex workflow, so rather than start with that, let's cover the basics. 

Use Standard Feature Class Names

My example here fell apart because I was using the framework for a standard naming convention, but my naming convention  wasn't entirely standard. The framework that I was using creates feature class names based on who first published the data, and then what the data represents.  So, NHD_Flowlines means I got the data from NHD (USGS National Hydrography Dataset), and the data represent stream flow lines.

Second, while my example started off with a good name, I had not developed a standard convention for any of the processes that I ended up doing to my NHD_FlowlinesPlus dataset to produce my cryptically named datasets.  Before I explain what I should have done, I'll share the standard naming conventions I use:

  • Scale: _24K, 100K, 250K, 1M, 2M:  The first example means the data are either captured or generalized to be at a resolution appropriate for 1:24,000 scale maps.  The 1M means 1:1,000,000.  This is a relatively good convention; I say relatively, because the meaning is map product and data-production specific.  The product in this case is an on-screen map, and I use different data production methods from that which I would use for a printed map.
  • Mapping Purpose: _lab _sym, _master:  This refers to how I use these data in a map. If it is for labeling only (_lab),  for symbology only (_sym), or a dataset that I use to derive cartographic data, (_master). The context I have found most useful to use these abbreviations is ArcGIS Server, my goal there is to optimize the data to the greatest extent possible to improve drawing performance.  I covered how to set that data up in a recent blog entry on tips for improving drawing performance.
  • Vintage: _03, _07, Mar_08, Jun_06, etc.:  This is just a two-digit year so I can tell when data are captured. For imagery, it's useful to add at least the month or even the capture date to the name as seasonality often carries significant meaning.

Read More: Mapping Center : I remember making this feature class...I wonder why?

Mapping Center : Color ramps reorganized

Tuesday, May 13, 2008 6:00 AM - Jaynya

Color ramps reorganized

We recently made some changes to the color ramp styles on Mapping Center under the ArcGIS Resources tab. You will now find a single ZIP file that contains a variety of color ramps. Our purpose in reorganizing the color ramps was to make it easier to find and use the color ramps.   The way we did that was to organize all the color ramps of a particular theme into a separate style file.  Then we gave each of the style file a name that better describes the purpose of the color ramps.

The .zip file contains color ramps for the following:

  • Desert environments
  • Hypsometry (elevation) developed using Imhof’s guidelines in Cartographic Relief Presentation
  • Special cartographic effects (like the park boundary used on the Crater Lake National Park map)
  • Special events (fire, global warming)
  • Water bodies
  • Water dynamics (water currents – direction and velocity)
Click on any of the images below to see a full-size version of the contents of each of these styles:

 Desert Color Ramps - Click to see full size Effects Color Ramps - Click to see full size Events Color Ramps - Click to see full size

               Desert                               Effects                                  Events

Read more: Mapping Center : Color ramps reorganized